Download
1 / 30
300 likes | 711 Views
Measuring Weather. By: Brianna Shields November 1, 2005. DO NOW. Get your current event out on your desk 1. What is the source of all energy for planet Earth? 2. What is precipitation? 3. What tool is used to measure temperature? . Weather Measurements and Symbols. Temperature.

E N D
Measuring Weather By: Brianna Shields November 1, 2005
DO NOW • Get your current event out on your desk • 1. What is the source of all energy for planet Earth? • 2. What is precipitation? • 3. What tool is used to measure temperature?
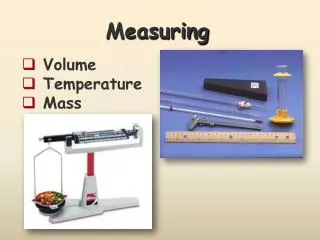
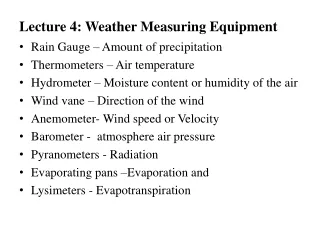
Weather Measurements and Symbols Temperature • Def: Average kinetic energy of air molecules measured with a thermometer • On map: number recorded in degrees F or C
Weather Measurements and Symbols Sky Conditions • Def: Sunny, cloudy, clear, overcast • On map: Draw picture of sun or clouds
Weather Measurements Wind Conditions • Def: The relative speed of the wind (calm, light, windy,, etc.) • On map: look at flag symbol
Weather Measurements Wind Direction • Def: Direction wind is blowing, tool: weather vane • On Map: Blows from flag to ball towards N, S, E or W
Weather Measurements Wind Speed • Def: How fast the wind is blowing • Blows from high to low pressure areas • Map: notches on flag symbol
Weather Measurements Precipitation Type • Def: Type of water drops falling (due to temperature) • Ex: rain, drizzle, snow, sleet • Map: Draw as picture or shade map in colors
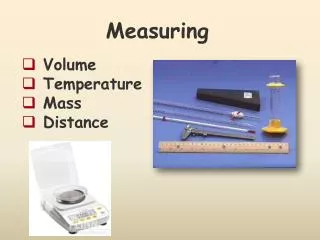
Weather Measurements Precipitation Amount • Def: Amount of rain in inches or centimeters • Tool: Rain gauge • Map: None
Weather Measurements Humidity • Def: Amount of invisible water vapor in air measured by a hygrometer • Warm air= more humidity • Full air = saturated • Map: None
Weather Measurements Air Pressure • Def: Amount of pressure exerted by columns of air • High Pressure = dense air • Tool: Barometer • On Map: numbers written in millibars and connected by rings
Weather Measurements Dewpoint • Def: Saturated air that cools causes drops of water to condense • Map: None
Weather Symbols Fronts • Warm • Cold • Stationary
Weather Symbols Pressure Systems • High • Low
Weather Journal • Get out your weather logging journal • One student, will go to the library and get the weather conditions from the Weather Station. • Fill this in on page 1 of your journal under the Jamestown, NY “Library Station” weather section
Weather Journal • Look in the Post Journal for Jamestown’s weather forecast. • Fill the weather conditions into your weather logging journal on page two.
Weather Journal • Visit the weather underground site and fill in the weather forecast for Jamestown, NY. • This goes on page two of our weather journal. • To find the weather forecast, type the city and state name in the top left corner of the screen
Weather Journal • Visit the weather underground site again and enter the weather conditions for each of these cities: • Montgomery, Alabama • Wichita, Kansas • This goes on page seven of your weather journal.
Weather Journal • Visit the CNN weather maps and try to make predictions about tomorrow’s weather in the following cities: • Jamestown, New York • Montogomery, Alabama • Wichita, Kansas • This goes on page twelve of your weather journal, under DAY ONE. • If you don’t know where in the U.S. each state is located, use a U.S. Map to find each one.
Weather Journal • Visit the webcams for each of the cities listed below. Try to guess what the temperature, sky conditions, windspeed, time of day, precipitation and visibility are for each city by observing the webcam. • Moscow, Russia • Russia 2 • Buenos Aires, Argentina • New York City, New York • Your predictions go on page fifteen of your weather journal, under WEBCAM WEATHER.
Weather Journal • Visit the links below to determine the actual weather conditions in the webcam cities • Moscow, Russia • New York City, New York • Buenos Aires, Argentina • Record the actual weather conditions on page fifteen of your weather journal, under ACTUAL WEATHER.