Download
1 / 1
10 likes | 125 Views
Upper-air stations. Central Russia. Sergei A. Sitnov. (M). A. M. Obukhov Institute of Atmospheric Physics, Russian Academy of Sciences, Moscow, Russia (sitnov@ifaran.ru).

E N D
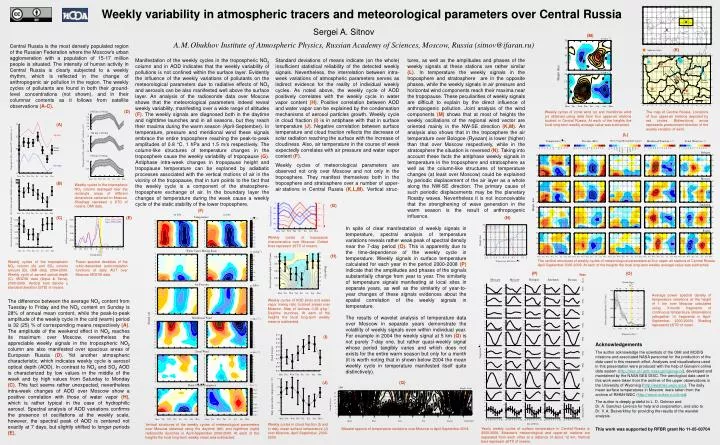
Upper-air stations Central Russia Sergei A. Sitnov (M) A.M.Obukhov Institute of Atmospheric Physics, Russian Academy of Sciences, Moscow, Russia (sitnov@ifaran.ru) Central Russia is the most densely populated region of the Russian Federation where the Moscow's urban agglomeration with a population of 15-17 million people is situated. The intensity of human activity in Central Russia is clearly subjected to a weekly rhythm, which is reflected in the change of anthropogenic air pollution in the region. The weekly cycles of pollutants are found in both their ground-level concentrations (not shown), and in their columnar contents as it follows from satellite observations (A-C). (K) Standard deviations of means indicate (on the whole) insufficient statistical reliability of the detected weekly signals. Nevertheless, the interrelation between intra-week variations of atmospheric parameters serves as indirect evidence for the reality of individual weekly cycles. As noted above, the weekly cycle of AOD positively correlates with the weekly cycle in water vapor content (H). Positive correlation between AOD and water vapor can be explained by the condensation mechanisms of aerosol particles growth. Weekly cycle in cloud fraction (I) is in antiphase with that in surface temperature (J). Negative correlation between surface temperature and cloud fraction reflects the decrease of solar radiation reaching the surface with the increase of cloudiness. Also, air temperature in the course of week expectedly correlates with air pressure and water vapor content (F). Weekly cycles of meteorological parameters are observed not only over Moscow and not only in the troposphere. They manifest themselves both in the troposphere and stratosphere over a number of upper-air stations in Central Russia (K,L,M). Vertical struc- Manifestation of the weekly cycles in the tropospheric NO2 column and in AOD indicates that the weekly variability of pollutions is not confined within the surface layer. Evidently the influence of the weekly variations of pollutants on the meteorological parameters due to radiative effects of NO2 and aerosols can be also manifested well above the surface layer. An analysis of the radiosonde data over Moscow shows that the meteorological parameters indeed reveal weekly variability, manifesting over a wide range of altitudes (F). The weekly signals are diagnosed both in the daytime and nighttime launches and in all seasons, but they reach their maxima during the warm season (April-September). In temperature, pressure and meridional wind these signals embrace the entire troposphere reaching the peak-to-peak amplitudes of 0.8 °C, 1 hPa and 1.5 m/s respectively. The column-like structures of temperature changes in the troposphere cause the weekly variability of tropopause (G). Antiphase intra-week changes in tropopause height and tropopause temperature can be explaned by adiabatic processes associated with the vertical motions of air in the vicinity of the tropopause, that in turn points to the fact that the weekly cycle is a component of the stratosphere-troposphere exchange of air. In the boundary layer the changes of temperature during the week cause a weekly cycle of the static stability of the lower troposphere. tures, as well as the amplitudes and phases of the weekly signals at these stations are rather similar (L). In temperature the weekly signals in the troposphere and stratosphere are in the opposite phases, while the weekly signals in air pressure and horizontal wind components reach their maxima near the tropopause. These peculiarities of weekly signals are difficult to explain by the direct influence of anthropogenic pollution. Joint analysis of the wind components (M) shows that at most of heights the weekly oscillations of the regional wind vector are oriented mainly in the NW-SE direction (K,M). An analysis also shows that in the troposphere the air temperature over Bologoe (Ryazan) is lower (higher) than that over Moscow respectively, while in the stratosphere the situation is reversed (N). Taking into account these facts the antiphase weekly signals in temperature in the troposphere and stratosphere as well as the column-like structures of temperature changes (at least over Moscow) could be explained by periodic displacement of the air layer as a whole along the NW-SE direction. The primary cause of such periodic displacements may be the planetary Rossby waves. Nevertheless it is not inconceivable that the strengthening of wave generation in the warm season is the result of anthropogenic influence. Weekly variability in atmospheric tracers and meteorological parameters over Central Russia (D) Weekly cycles of zonal wind (u) and meridional wind (v) obtained using data from four upper-air stations located in Central Russia. At each of the heights the local long-term weekly average value was subtracted. The map of Central Russia. Locations of four upper-air stations depicted by red circles. Bidirectional arrow represents predominant direction of the weekly variation of wind. (A) (L) (B) Weekly cycles in the tropospheric NO2 column averaged over the rectangle areas of different dimensions centered on Moscow. Shadings represent ± STD of means. OMI data. (G) (F) (C) (E) (N) In spite of clear manifestation of weekly signals in temperature, spectral analysis of temperature variations reveals rather weak peak of spectral density near the 7-day period (O). This is apparently due to the time-dependence of the weekly cycle in temperature. Weekly signals in surface temperature calculated for each year in the period 2000-2008 (P) indicate that the amplitudes and phases of the signals substantially change from year to year. The similarity of temperature signals manifesting at local sites in separate years, as well as the similarity of year-to-year changes of these signals evidences about the spatial correlation of the weekly signals in temperature. The results of wavelet analysis of temperature data over Moscow in separate years demonstrate the volatility of weekly signals even within individual year. For example in 2004 the weekly signal at 5 km (Q) is not purely 7-day one, but rather quasi-weekly signal whose period tangibly varies and which does not exists for the entire warm season but only for a month (it is worth noting that in shown below 2004 the mean weekly cycle in temperature manifested itself quite distinctively). Weekly cycles of tropopause characteristics over Moscow. Dotted lines represent ±STD of means. (H) The vertical structures of weekly cycles of meteorological parameters at four upper-air stations of Central Russia. April-September 2000-2009. At each of the heights the local long-term weekly average value was subtracted. Weekly cycles of the tropospheric NO2 column (A) and SO2 column amount (B). OMI data, 2004-2009. Weekly cycle of aerosol optical depth (C). MODIS data (Aqua & Terra), 2000-2009. Vertical bars denote ± standard deviation (STD) of means. Power spectral densities of the cubic-detrended autocorrelation functions of daily AOT over Moscow. MODIS data. 0 (P) (O) Year -0.1 0.1 +0.1 Average power spectral density of temperature variations at the height of 1 km over Moscow calculated using 3-month fragments of continuous temperature observations (altogether 14 fragments in April-September, 2000-2009). Shading represents ±STD of mean. The difference between the average NO2 content from Tuesday to Friday and the NO2 content on Sunday is 28% of annual mean content, while the peak-to-peak amplitude of the weekly cycle in the cold (warm) period is 32 (25) % of corresponding means respectively (A). The amplitude of the weekend effect in NO2 reaches its maximum over Moscow, nevertheless the appreciable weekly signals in the tropospheric NO2 column are also manifested over spacious areas of European Russia (D). Yet another atmospheric characteristic, which indicates weekly cycle is aerosol optical depth (AOD). In contrast to NO2 and SO2 AOD is characterized by low values in the middle of the week and by high values from Saturday to Monday (C). This fact seems rather unexpected, nevertheless intra-week changes of AOD over Moscow show a positive correlation with those of water vapor (H), which is rather typical in the case of hydrophilic aerosol. Spectral analysis of AOD variations confirms the presence of oscillations at the weekly scale, however, the spectral peak of AOD is centered not exactly at 7 days, but slightly shifted to longer periods (E). Weekly cycles of AOD (line) and water vapor mixing ratio (colored areas) over Moscow. Step of isolines 0.02 g.kg-1. Daytime launches. At each of the heights the local long-term weekly mean is subtracted. (I) Acknowledgements The author acknowledge the scientists of the OMI and MODIS missions and associated NASA personnel for the production of the data used in this research effort. Analyses and visualizations used in this presentation were produced with the help of Giovanni online data system (http://disc.sci.gsfc.nasa.gov/giovanni), developed and maintained by the NASA GES DISC. The aerological data used in this work were taken from the archive of the upper observations in the University of Wyoming (http://weather.uwyo.edu). The daily mean surface temperatures in Moscow were taken from the archive of RIHMI-WDC (http://aisori.meteo.ru/climat). The author is deeply grateful to L. D. Oolman and Dr. A. Sanchez-Lorenzo for help and cooperartion, and also to Dr. V. A. Bezverkhny for providing the results of the wavelet analysis. This work was supported by RFBR grant No 11-05-00704 C (J) (Q) Weekly cycles in cloud fraction (I) and in daily mean surface temperature (J) over Moscow. April-September, 2000-2009 Vertical structures of the weekly cycles of meteorological parameters over Moscow obtained using the daytime (left) and nighttime (right) radiosonde launches in April-September 2000-2009. At each of the heights the local long-term weekly mean was subtracted. Yearly weekly cycles of surface temperature in Central Russia in 2000-2008. Moscow’s meteorological and upper-air stations are separated from each other at a distance of about 12 km. Vertical bars represent ±STD of means. Wavelet spectra of temperature variations over Moscow in April-September 2004.