Download
1 / 28
280 likes | 403 Views
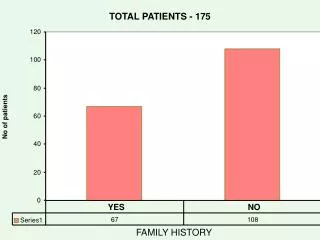
Oklahoma Primary Care Association Uniform Data System Data for Oklahoma Community Health Centers (2011 and Other Selected Years). Oklahoma Primary Care Association Total Patients Served at CHCs Statewide 2002-2011. + 2.8%. + 10.8%.

E N D
Oklahoma Primary Care Association Uniform Data System Data for Oklahoma Community Health Centers (2011 and Other Selected Years)
Oklahoma Primary Care Association Total Patients Served at CHCs Statewide2002-2011 +2.8% +10.8% Number of Grantees: 5 6 7 9 11 13 13 17 17 17 Source: Annual State UDS Rollup Reports, 2002 to 2011, EHB Center reports Produced by OKPCA, 08/12
Oklahoma Primary Care Association Total Patient Encounters at CHCs Statewide2002-2011 +4.0% +18.1% Number of Grantees: 5 6 7 9 11 13 13 17 17 17 Source: Annual State UDS Rollup Reports, 2002 to 2010; 2011 estimates from preliminary Center reports Produced by OKPCA, 08/12
Oklahoma Primary Care Association 2002-2011 Who Oklahoma’s CHCs Serve
Oklahoma Primary Care Association Total Patients Served at Oklahoma CHCs by Age Group2002-2011 Source: Annual State UDS Rollup Reports, 2002 to 2011
Oklahoma Primary Care Association Percent of Patients by Payer Sources at Oklahoma CHCs, 2002-2011 Source: Annual State UDS Rollup Reports, 2002 to 2011 Produced by OKPCA, 08/12
Oklahoma Primary Care Association Percent of CHC Patients Receiving Medicaid 2002-2011 Source: Annual State UDS Rollup Reports, 2002 to 2011 Oklahoma Primary Care Association 4300 N Lincoln Blvd, Ste 203 Oklahoma City, OK 73105 Produced by OKPCA, 08/12
Oklahoma Primary Care Association Patients by Federal Poverty Level (FPL)* Served at OK CHCs, 2011 Source: Annual State UDS Rollup Reports, 2011 *Patients with “Unknown” income sources not reflected; does not reflect the data of CHC patients statewide not reporting incomes. Oklahoma Primary Care Association 4300 N Lincoln Blvd, Ste 203 Oklahoma City, OK 73105 Produced by OKPCA, 08/12
Oklahoma Primary Care Association Patients by Federal Poverty Level (FPL)* Served at OK CHCs, 2010 Source: Annual State UDS Rollup Reports, 2010 *Patients with “Unknown” income sources not reflected; does not reflect the data of CHC patients statewide not reporting incomes.
Oklahoma Primary Care Association Distribution of Oklahoma CHC Staff, Clinicians & Other Specialists, Clinical Mid-Level, Other Clinical & All Other, 2011 Clinicians: Physicians, Dentists, Psychiatrists Licensed Behavioral Specialists Clinical Mid-Level: NPs, PA, CNM, Dental Hygienists All Other Clinical: Nurses, Dental Assistants, Other Behavioral Health Specialists (Non-Licensed), Case Managers & Other enabling specialists, Pharmacy Source: Annual State UDS Rollup Reports, 2011
Oklahoma Primary Care Association Distribution of Oklahoma CHC Staff, Clinicians & Other Specialists, Clinical Mid-Level, Other Clinical & All Other, 2010 Clinicians: Physicians, Dentists, Psychiatrists Licensed Behavioral Specialists Clinical Mid-Level: NPs, PA, CNM, Dental Hygienists All Other Clinical: Nurses, Dental Assistants, Other Behavioral Health Specialists (Non-Licensed), Case Managers & Other enabling specialists, Pharmacy Source: Annual State UDS Rollup Reports, 2010
Oklahoma Primary Care Association 2010-2011 Profiles of Quality of Care
Oklahoma Primary Care Association • CHCs report health outcomes data. These QUALITY OF CARE measures are being reported by every CHC in the nation: • Percent of pregnant women beginning prenatal care in the first trimester. • Percent of toddlers (age 2 and older) with appropriate immunizations • Percent of women age 21-64 who received 1 or more Pap tests during the year • Percent of persons with diabetes whose HbA1c levels are ≤ 9% • Percent of adults age 18 and older+ diagnosed with hypertension • Percent of births less than 2500 grams to health center patients
Oklahoma Primary Care Association Clinical Outcomes for State CHCs vs. CHCs Nationwide, 2011 Source: Annual State and National UDS Rollup Reports, 2011
Oklahoma Primary Care Association Clinical Outcomes for State CHCs vs. CHCs Nationwide, 2010 Source: Annual State UDS Rollup Reports, 2010
Oklahoma Primary Care Association • Newest required health outcomes data: • Asthma Treatment Plan (Asthma patients ages 5-40 have acceptable pharmacological treatment plan) • Tobacco Cessation Intervention (Tobacco patients ages 18 & older have received cessation advice or medication) • Tobacco Assessment (Patients have been asked about tobacco use one ore more times in measurement or prior year) • Adult Weight Screening and Follow-up (Patients ages 18 & older with BMI charted and follow-up plan documented if overweight or underweight) • Child and Adolescent Weight Assessment and Counseling (Children and adolescent ages 3-17 with a BMI percentile, and counseling on nutrition and physical activity documented for the current year)
Oklahoma Primary Care Association Newest Clinical Outcomes for State CHCs vs. CHCs Nationwide, 2011 Source: Annual State and National UDS Rollup Reports, 2011
Oklahoma Primary Care Association 2008-2011 Revenue and Cost Data
Oklahoma Primary Care Association State CHC Revenue Mix by Payer Sources, 2011 Oklahoma CHCs $96,421,032 Source: Annual State UDS Rollup Reports, 2011
Oklahoma Primary Care Association Patient Service Revenue for CHCs Nationwide vs. State CHCs 2011 2011 Revenue CHCs Nationwide $13,880,314,144 2011 Revenue Oklahoma CHCs $96,421,032 Source: Annual State & National UDS Rollup Reports, 2011
Oklahoma Primary Care Association State CHC Revenue Mix by Payer Sources, 2009 and 2010 2010 Revenue Oklahoma CHCs $85,772,814 2009 Revenue Oklahoma CHCs $65,987,635 Source: Annual State UDS Rollup Reports, 2009 and 2010
Oklahoma Primary Care Association State vs. National Medical Care Costs per Encounter 2002 to 2011 Source: Annual State & National UDS Rollup Reports, 2002 to 2011 Oklahoma Primary Care Association 4300 N Lincoln Blvd, Ste 203 Oklahoma City, OK 73105
Oklahoma Primary Care Association State vs. National Total Care Costs per Patient 2002 to 2011 Source: Annual State & National UDS Rollup Reports, 2002 to 2011
Oklahoma Primary Care Association 2011 Access to Care: Oklahoma Maps
Oklahoma Primary Care AssociationCHCs (18) and Satellites (28), with Other (Non-CHC) FQHCs (7) Oklahoma Primary Care AssociationCommunity Health Centers (18) and Satellites (22), and Other (Non-CHC) FQHCs (8) Oklahoma Primary Care Association 4300 N Lincoln Blvd, Ste 203 Oklahoma City, OK 73105 405.424.2282 ~ Fax 405.424.1111 Sources: HRSA, OKPCA, ESRI Produced by: OKPCA [Updated 08/2012]
Oklahoma Primary Care Association Population-to-Physician FTE Ratio by County & Congressional Districts (2011) Oklahoma Primary Care Association 4300 N Lincoln Blvd, Ste 203 Oklahoma City, OK 73105 405.424.2282 ~ Fax 405.424.1111 Produced by: OKPCA, 1/12 Sources: HRSA, OKPCA, Census, ESRI
Oklahoma Primary Care Association Population by Census Tract and Congressional Districts (2011) Oklahoma Primary Care Association 4300 N Lincoln Blvd, Ste 203 Oklahoma City, OK 73105 405.424.2282 ~ Fax 405.424.1111 Produced by: OKPCA, 1/12 Sources: HRSA, OKPCA, Census, ESRI