Download
1 / 36
360 likes | 468 Views
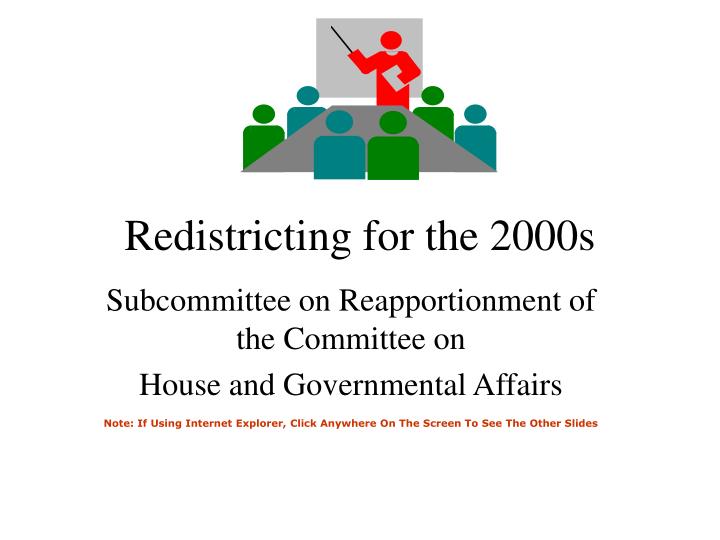
Redistricting for the 2000s. Subcommittee on Reapportionment of the Committee on House and Governmental Affairs Note: If Using Internet Explorer, Click Anywhere On The Screen To See The Other Slides. 2000 Census Population Data. December 28, 2000

E N D
Redistricting for the 2000s Subcommittee on Reapportionment of the Committee on House and Governmental Affairs Note: If Using Internet Explorer, Click Anywhere On The Screen To See The Other Slides
2000 Census Population Data • December 28, 2000 • Population released to the President of the United States • Apportionment Count: 4,480,271 • Includes 11,295 Overseas Military and Federal civilian employees and dependents
STATE GROWTH • State Resident Population: 4,468,976 • Grew 249,003 or 5.9% since 1990 • Average Growth South: 17.3% Nation: 13.2% • State Rank dropped from 21 to 22
Census Population Data • P.L. 94-171 data (Redistricting data) was released to Louisiana on March 9, 2001 • P.L. 94-171 Data Includes the Following Tabulations By Precinct: • Total Population • Voting Age Population (over 18) • Racial Data
General Population Information • 34 Parishes did not grow at a rate equal to or above the State growth of 5.9% • Of those, 14 Parishes Actually Lost Population-- 12 North and Central Louisiana Parishes and Orleans and St. Mary Parishes • 30 Parishes exceeded the State’s rate
Growth Areas **10,000 or more • The Florida Parishes, particularly St. Tammany, Livingston, Tangipahoa, and East Baton Rouge Parishes • Acadiana, particularly Lafayette Parish • The River Region, particularly Ascension Parish • Calcasieu Parish • Bossier Parish
Numeric St. Tammany (46,760) EBR (32,747) Lafayette (25,741) Livingston (21,288) Ascension (18,413) Calcasieu (15,443) Tangipahoa (14,879) Bossier (12,222) Terrebonne (7,521) St. Landry (7,369) Percentage St. Tammany (32.36%) Ascension (31.63%) Livingston (30.18%) Allen (19.85%) Tangipahoa (17.36%) W. Feliciana (17.00%) Lafayette (15.62%) Bossier (14.20%) St. Charles (13.28%) WBR (11.24%) Top TenGrowing Parishes
Areas of Loss • Orleans Parish • Central Louisiana, particularly Vernon and Rapides Parishes • North Louisiana • St. Mary Parish
Numeric Orleans (-12,264) Vernon (-9,430) Rapides (-5,219) St. Mary (-4,586) Franklin (-1,124) Morehouse (-917) Concordia (-581) Claiborne (-554) Tensas (-485) Jackson (-308) Percentage Vernon (-15.22%) St. Mary (-7.90%) Tensas (-6.83%) Franklin (-5.02%) Rapides (-3.97%) Claiborne (-3.18%) E. Carroll (-2.97%) Morehouse (-2.87%) Concordia (-2.79%) Orleans (-2.47%) Areas of LossTop Ten
1990 Ideal: 40,190 + 5% Range (2,009) Low: 38,181 High: 42,199 2000 Ideal: 42,561 + 5% Range (2,128) Low: 40,433 High: 44,689 House District Population1990s v. 2000s
House Statistics • Relative Range: –22.26 to 40.86 % • Overall Range: 63.12% • Difference between lowest and highest district is 26,865 • 38 House Districts are within the acceptable population range • 29 House Districts are above the acceptable population range • 38 House Districts are below the acceptable population range
1990 Ideal: 602,853 2000 Ideal: 638,425 Congressional District Population1990s v. 2000s
CongressMal-Apportionment Statistics Relative Range: -7.21% to 7.01% Relative Overall Range: 14.22%
1990 Ideal: 602,853 + 5% Range (30,142) Low: 572,711 High: 632,995 2000 Ideal: 638,425 + 5% Range (31,921) Low: 606,504 High: 670,346 Supreme Court District Population1990s v. 2000s
1990 Ideal: 843,994 + 5% Range (42,199) Low: 801,795 High: 886,193 2000 Ideal: 893,795 + 5% Range (44,689) Low: 849,106 High: 938,484 Public Service Commission District Population 1990s v. 2000s
1990 Ideal: 527,496 + 5% Range (26,379) Low: 501,122 High: 553,870 2000 Ideal: 558,622 + 5% Range (27,931) Low: 530,691 High: 586,553 BESE District Population1990s v. 2000s*
BESE Malapportionment Statistics