Download
1 / 28
280 likes | 401 Views
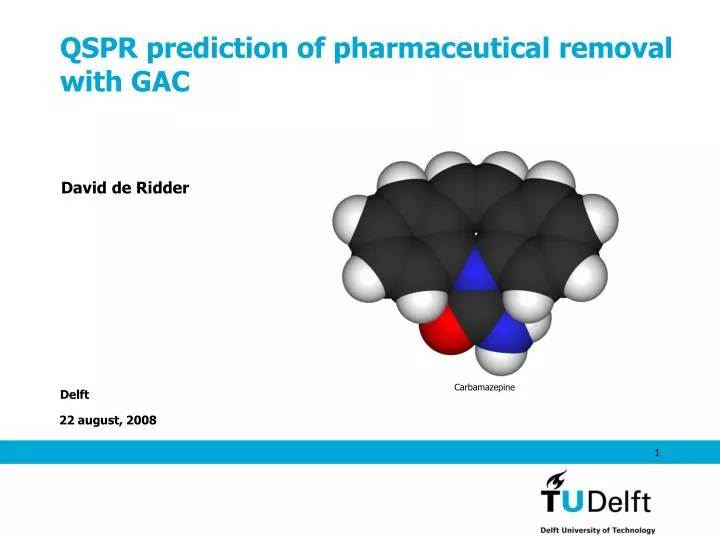
QSPR prediction of pharmaceutical removal with GAC. David de Ridder. Carbamazepine. Delft. Problem statement micropollutants. 100.000+ different micropollutants in surface water Variable mixture RIWA Rijn measures about 250 org. micropollutants Analysis programs costly and time consuming

E N D
QSPR prediction of pharmaceutical removal with GAC David de Ridder Carbamazepine Delft
Problem statementmicropollutants • 100.000+ different micropollutants in surface water • Variable mixture • RIWA Rijn measures about 250 org. micropollutants • Analysis programs costly and time consuming • QSAR can be used as a screening tool
QSAR werkDavid de Ridder Singular processes • Activated carbon (AC) • Aeration • Ozone • UV Combinations of processes • AC-UV/H2O2-AC • (RBF)-NF-AC
Activated carbon Research objectives Estimate: • Influence of turbulence on adsorption kinetics • Influence of water quality • Influence of preloading carbon • Construction of QSPR model • Accuracy of QSPR prediction Ce, qe
Experiment set-up • 2 litre solution • Kinetic @ 200 mg carbon • Adsorption time 1 day – 6 weeks • Equilibrium @ 20-2000 mg carbon • Adsorption time 8 weeks • Carbon 0,63-0,71 mm
ResultsKinetic experiments • Lower turbulence decreases adsorption significantly • Preloading large influence on negatives, and no significant effect on positives.
Resultsinitial remarks • MW in range 200-300 D no significant influence • Log D has higher impact on removal of negatives • At similar pKa, higher log D yields higher removal • At similar log D, positives are removed 1,2-2 times more effective than negatives • In wastewater: • Positives comparable removal as surface water • Neutrals better removal than in surface water • Significant removal of 4 negatives in blank!
Resultshypotheses • Preloading creates a negatively charged layer onto the carbon, rejecting negatives and attracting positives • In the MW range of 200-300 D, probably most carbon micropores will be available for adsorption • In wastewater, (bio)degradation of negatives is preferred.
Results - QSPR construction • 4 (out of 21) compounds excluded for verification • MLR (multivariable linear regression) prediction model
Results – model accuracy Consequent over/underprediction Less data available Specific mispredictions
Initial conclusionsModel prediction • Applied carbon dose too high -> ultrapure models inaccurate • Initial degradation negatives wastewater -> negatives not taken properly into account • Surface water: general underprediction Ce at higher carbon dose • Wastewater: Specific overprediction Ce (Terbutaline, Salbutamol, metropolol, Clenbuterol, Aminopyrine) • Demiwater PL: consequent over/underprediction
Further research Dataset • Larger variation MW (if relevant) Process conditions • Carbon type • Change preparation preloaded carbon • Lower carbon doses • pH variation at same water quality (decrease charge negatives, lower log D negatives & higher log D positives) Analysis • ATP to check for biological activity • NOM characterisation (blank & adsorbed (?)) • Carbon characterisation (PSD, hydrophobicity, carbon pKa)