Download
1 / 12
120 likes | 208 Views
The latest calibration findings reveal significant parameter variations in P2 and P3 systems, prompting investigation into potential asymmetries and discrepancies. Notably, P3's calibration constant differs, potentially due to an asymmetry caused by a broken x-strip. Meanwhile, P2x variation (as ZV6X is varied) and P1y, P2y, and P3y variations (as ZH4X is varied) show notable discrepancies with significant differences in magnitudes. Further checks with Javier are planned to assess transfer matrices and identify root causes, including potential rotation errors or dead strips affecting calibration. Stay tuned for updates on calibration constants and correlation discrepancies in P2 systems.

E N D
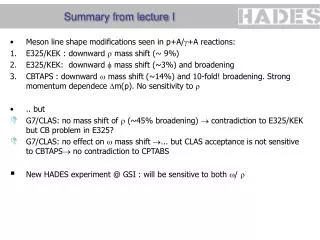
Calibration summary from 17/12/09 shift R. Apsimon
P3 y calibration Not yet sure why the calibration constant for P3 is different, will check the transfer matrix with Javier, might be due to asymmetry caused by broken x-strip, but that’s probably just a total guess!
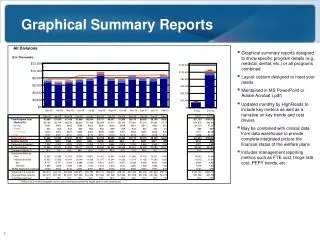
Sum_x to sum_y correlation in P2 for ycal Sum_y Sum_x
P3y variation as ZH4X is varied The variation here is 20 times larger than in P1 and 5 times larger than in P2, cannot believe this is due to rotation error in P3, maybe dead strip?
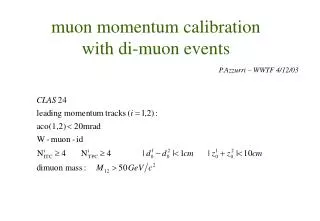
P2x x calibration Previous week’s calibration constant here was about 0.01, half of what is expected, now it is half that again, suspect I need to check transfer matrix with Javier, but as this was the damaged processor, I will also check the output in case this is (partly) a hardware issue.
Sum_x to sum_y correlation in P2 for xcal Sum_y Sum_x
Some quick notes • Sum counts are consistently lower in x than y in P2. As is calibration constant, need to look into this. • Tried to look at feedback gain, but didn’t get sensible results, will start simple (eg. T-shirt plots) and go from there, will show results in new year.