Download

1 / 31
320 likes | 641 Views
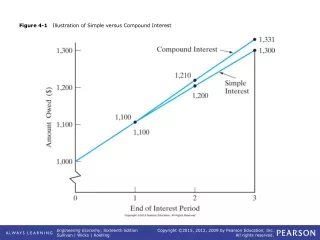
Figure 4-1 Illustration of Simple versus Compound Interest. TABLE 4-1 Three Plans for Repayment of $17,000 in Four Months with Interest at 1% per Month. TABLE 4-1 (continued) Three Plans for Repayment of $17,000 in Four Months with Interest at 1% per Month.

E N D
TABLE 4-1 Three Plans for Repayment of $17,000 in Four Months with Interest at 1% per Month
TABLE 4-1 (continued) Three Plans for Repayment of $17,000 in Four Months with Interest at 1% per Month
Figure 4-2 Cash-Flow Diagram for Plan 3 of Table 4-1 (Credit Card Company’s Viewpoint)
Figure 4-3 Cash-Flow Diagram for Plan 2 of Table 4-1 (Lender’s Viewpoint)
TABLE 4-2 Discrete Cash-Flow Examples Illustrating Equivalence
TABLE 4-2 (continued) Discrete Cash-Flow Examples Illustrating Equivalence
Figure 4-6 General Cash-Flow Diagram Relating Uniform Series (Ordinary Annuity) to Its Present Equivalent and Future Equivalent Values
Figure 4-7 Relationship of Cash Flows for Plan 2 of Table 4-1 to Repayment of the $17,000 Loan Principal
Figure 4-8 Using Linear Interpolation to Approximate i in Example 4-13
TABLE 4-3 Discrete Compounding-Interest Factors and Symbolsa
Figure 4-9 General Cash-Flow Representation of a Deferred Annuity (Uniform Series)
Figure 4-10 Example 4-16 for Calculating the Equivalent P, F, and A Values
Figure 4-13 Cash-Flow Diagram for a Uniform Gradient Increasing by G Dollars per Period
Figure 4-16 Cash-Flow Diagram for a Geometric Sequence of Payments Increasing at a Constant Rate of ƒ per Period