Download

1 / 55
550 likes | 561 Views
Sections 3.3 & 3.4. Quiz tomorrow. For quiz, you may use back side of card you used for Quiz 3.1 – 3.2. For quiz on which day? you may use back side of card you used for Quiz 3.1 – 3.2 For test on which day? you may use both sides of 1 note card. Do Not Shout Out Answers!.

E N D
Sections 3.3 & 3.4 Quiz tomorrow
For quiz, you may use back side of card you used for Quiz 3.1 – 3.2
For quiz on which day? • you may use back side of card you used for Quiz 3.1 – 3.2 • For test on which day? • you may use both sides of 1 note card
Do Not Shout Out Answers! Please give everyone a chance to think about the questions.
Do Not Shout Out Answers! 1. When is it appropriate to use a least squares regression line (LSRL) or correlation? 2. When should you recommend using a line to model the data?
1. When is it appropriate to use a least squares regression line (LSRL) or correlation? 2. When should you recommend using a line to model the data? Only when you have a linear pattern.
1. When is it appropriate to use a least squares regression line (LSRL) or correlation? 2. When should you recommend using a line to model the data? Only when you have a linear pattern. Does the strength matter?
1. When is it appropriate to use a least squares regression line (LSRL) or correlation? 2. When should you recommend using a line to model the data? Only when you have a linear pattern. Does the strength matter? NO!
Your own opinion about whether there should actually be a relationship between the variables does not mean anything. The only thing that matters is whether or not the pattern is linear.
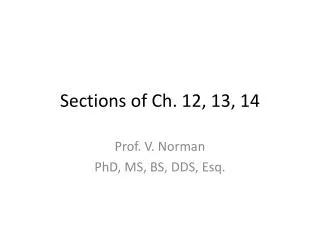
Page 158, E27 Choose from - 0.06, 0.25, 0.40, 0.52, 0.66, 0.74, 0.85, and 0.90
Page 158, E27 Choose from - 0.06, 0.25, 0.40, 0.52, 0.66, 0.74, 0.85, and 0.90 - 0.06
Page 158, E27 Choose from - 0.06, 0.25, 0.40, 0.52, 0.66, 0.74, 0.85, and 0.90 - 0.06 0.90
Page 158, E27 Choose from -0.06, 0.25, 0.40, 0.52, 0.66, 0.74, 0.85, and 0.90 - 0.06 0.40 0.66 0.25 0.85 0.52 0.90 0.74
An equation for a valid LSRL is: height = 3.4 + 0.165(age). Valid LSRL is guarantee the data has a linear pattern.
An equation for a valid LSRL is: height = 3.4 + 0.165(age). If the standard deviation of ages is 12 years and the standard deviation of heights is 2.2 inches, find the correlation between height and age.
An equation for a valid LSRL is: height = 3.4 + 0.165(age). If the standard deviation of ages is 12 years and the standard deviation of heights is 2.2 inches, find the correlation between height and age.
An equation for a valid LSRL is: height = 3.4 + 0.165(age). If the standard deviation of ages is 12 years and the standard deviation of heights is 2.2 inches, find the correlation between height and age.
An equation for a valid LSRL is: height = 3.4 + 0.165(age). If the standard deviation of ages is 12 years and the standard deviation of heights is 2.2 inches, find the correlation between height and age. r = 0.9
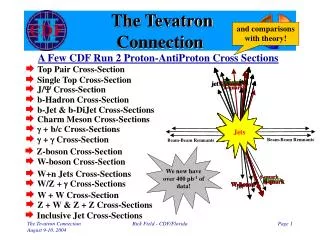
Page 174, Display 3.77 Which of these four residual plots correspond to a linear pattern?
Page 206, E73 a) The correlation is to bivariate data what the standard deviation is to univariate data.
Page 206, E73 a) The correlation is to bivariate data what the standard deviation is to univariate data. True. Both measure how closely the points cluster about the “center” of the data. For univariate data using standard deviation, that center is the mean; for bivariate data, the center is the regression line.
Page 206, E73 b) The correlation measures direction and strength but not shape.
Page 206, E73 b) The correlation measures direction and strength but not shape. True. Correlation can not be used to determine the shape.
Page 206, E73 b) The correlation measures direction and strength but not shape. True. Correlation can not be used to determine the shape. r = 0.48 r = 0.91
Page 206, E73 c) If the correlation is near 0, knowing the value of one variable gives you a narrow interval of likely values for the other variable.
Page 206, E73 c) If the correlation is near 0, knowing the value of one variable gives you a narrow interval of likely values for the other variable. False. Correlation near 0 means there is no shape. The weaker the correlation, the greater the prediction errors.
Page 206, E73 d) No matter what data set you look at, the correlation coefficient, r, and the least squares slope, b1, will always have the same sign.
Page 206, E73 d) No matter what data set you look at, the correlation coefficient, r, and the least squares slope, b1, will always have the same sign. True.
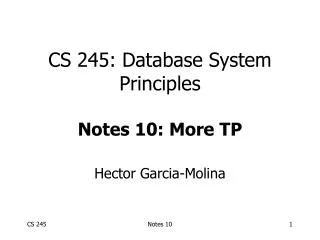
Page 207, Display 3.128 Determine the equation for the LSRL and correlation for predicting expenditures for police from number of police officers.
Page 207, Display 3.128 Determine the equation for the LSRL and correlation for predicting expenditures for police from number of police officers. Explanatory variable is _________. Response variable is ___________.
Page 207, Display 3.128 Determine the equation for the LSRL and correlation for predicting expenditures for police from number of police officers. Explanatory variable is _________. Response variable is ___________.
Page 207, Display 3.128 Determine the equation for the LSRL and correlation for predicting expenditures for police from number of police officers. LSRL: expenditures = - 402.8 + 73.74 (number of officers) r = 0.98
Page 207, Display 3.128 • Construct the scatter plot for predicting expenditures for police from number of police officers.
Page 207, Display 3.128 • Construct the residual plot for predicting expenditures for police from number of police officers.
When is it appropriate to use a least squares regression line (LSRL) or correlation?
When is it appropriate to use a least squares regression line (LSRL) or correlation? When you have a linear pattern.
When is it appropriate to use a least squares regression line (LSRL) or correlation? When you have a linear pattern. Does the strength matter?
When is it appropriate to use a least squares regression line (LSRL) or correlation? When you have a linear pattern. Does the strength matter? No
Write LSRL Equation Minimum wage = -196.977 + 0.100909(year)
When you describe the strength of a relationship of bivariate data, what do you need to address?
When you describe the strength of a relationship of bivariate data, what do you need to address? 1) how strong: weak, moderate, or strong