Download
1 / 41
410 likes | 412 Views
This presentation outlines the use of the Dynamical Likelihood Method for measuring the top quark mass at CDF RunII. Topics covered include data sample and event selection, signal Monte Carlo studies, background effects, current results, systematic uncertainty, and various checks and comparisons.

E N D
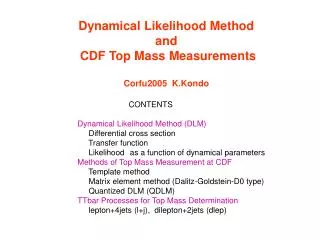
Top Quark Mass Measurement with Dynamical Likelihood Method at CDF RunII Kohei Yorita Kunitaka Kondo Waseda University , Japan For the CDF collaboration ~ FNAL Wine & Cheese Seminar ~ on June 11th, 2004
e b n d u μ Outline of this talk • Introduction • Data Sample & Event Selection • Dynamical Likelihood Method (DLM) • Signal Monte Carlo Studies • Background Effects • Current Results from RunII • Systematic Uncertainty • Various Checks & Some Comparisons 9. Conclusions Ms. Particle Q: How many particles in me?
~100% 15% 85% Top quark production and decay Tree level : The Tevatron is the only place which can produce top quark until LHC runs! qq , gg fractions reversed at LHC = 5.8 ~7.4 pb at 1.96TeV (Cacciari et al.) Final states : Use this channel with at least 1 bjet. • Dilepton (e,) BR=5% • Lepton (e, ) +jets BR=30% • All jets BR=44% • + X BR=21% * Higher statistics * Lower background June 11th , 2004 FNAL W&C Seminar - Kohei Yorita 3/41
MW ( Mtop2, ln(MH) ) 2 fb-1goal Why is Top Mass interesting? (1) Fundamental Standard Model parameter. (2) Top quark is heavy (~ 180 GeV) Yukawa coupling ~ 1. * The mass is near the Electro-Weak Symmetry breaking scale. * If we can measure strength of this coupling (i.e.ttH), a test of the Higgs sector in the SM can be done. • Special Relation to Higgs mass, together with W boson mass. (4) More detailed studies of top events by using “Mtop ” can be performed. i.e. ttbar resonance, P/CP test, W helicity, new particle search etc. RunII Goal : 2 ~ 3 GeV! June 11th , 2004 FNAL W&C Seminar - Kohei Yorita 4/41
Review of Run I Results Old World Average (1999) Mt = 174.3 5.1 GeV (3.24.0) (Fermilab-TM-2084) New DØ l+j measurement, (Nature 429, 638-642 (2004)) New World Average (2004) Mt = 178.0 4.3 GeV(2.73.3) hep-ex/0404010 Standard Model Higgs Mass: 62 42 Most probable: 96 GeV 113 GeV Upper limit(95% CL):219 GeV 237 GeV June 11th , 2004 FNAL W&C Seminar - Kohei Yorita 5/41
RunII Data at CDF RunII Detector Upgrades • New silicon tracker (7-8 layers) (||<2) • New central drift chamber • New time of flight detector • Extended muon coverage (||<1.5) • New DAQ Record initial luminosity = 8.2 1031 sec-1 cm-2 Data taking efficiency ~80-90% In this analysis, We use 162 pb-1 collected until September 2003. Cf) RunI ~110 pb-1 June 11th , 2004 FNAL W&C Seminar - Kohei Yorita 6/41
Event Selection Kinematical cuts for “lepton+jets” • One lepton : central electron / muon • Et(Pt) > 20 GeV, |eta| < ~1.0 • Met > 20 GeV • 4 tight jets : Et > 15 GeV, |eta| < 2.0 • At least one SVX b-tagged jet Exactly 4 jets SVX b jet tagging We do not use the events with more than 4jets, to minimize the contaminations by initial and final state radiation. B hadrons are long-lived. Identify by Vertex of displaced tracks Observed events : Total 22 events ; electrons 12, muons 10 June 11th , 2004 FNAL W&C Seminar - Kohei Yorita 7/41
The year Leon M. Lederman won the Nobel Prize ! For the neutrino beam method and the demonstration of the doublet structure of the leptons though the discovery of the muon neutrino. - Waseda colleagues have worked on the method for 5 years. - The latest formulation was submitted to JPS. Analysis information : Please visit CDF public web page, http://www-cdf.fnal.gov/physics/PublicResults.html DLM Introduction The Method : - Basic idea is to use matrix elements convoluted likelihood. - Originally proposed in 1988 by K. Kondo.(J.Phys. Soc. 57, 4126) June 11th , 2004 FNAL W&C Seminar - Kohei Yorita 8/41
Likelihood Definition in DLM For i-th event, likelihood is defined as, F : Parton distribution function for (za,zb) and Pt of tt system M: Matrix element of tt process, w : Transfer function, x ; partons y ; observables Sw=(l+)2 Two Summations and one integration : It : Possible combination(Jets to partons) , Is : Two z solutions, In practice, integration of x, sw made by Monte Carlo Method. Extract top mass by maximum likelihood method, Mtop = Mtop min. June 11th , 2004 FNAL W&C Seminar - Kohei Yorita 9/41
Performance : Demonstration!!! For ppt user! L 10 events likelihood distributions: L(M) 165 185 Mtop (GeV) June 11th , 2004 FNAL W&C Seminar - Kohei Yorita 10/41
parton jet dR=0.4 Transfer Functions ; w~ Jets to Partons ~ Jet Measurement and Energy Scale Correction at CDF All jets are formed by dR=0.4 cone cluster algorithm. We start with jets corrected by, (1) Calorimeter non-uniformity (2) Calorimeter Scale (3) Jets to hadrons Transfer function - To Go back to partons from jets, it is necessary. Transferred variable = At present, we ignore the difference of directions between parton & jets. June 11th , 2004 FNAL W&C Seminar - Kohei Yorita 11/41
Transfer Functions ; w~ Jets to Partons ~ is asymmetric and depends on Et &of the jets. Et bin : 9 bins 15-25-35-45-55-65-75-85-95-< Strong Et dependence b jets w jets Eta bin : 3 bins Central < 0.7 Wall 0.7~1.32 Plug > 1.32 30 histograms for each b/w jet. We do not fit them, but random generation along the shape to get parton momenta. b jets w jets June 11th , 2004 FNAL W&C Seminar - Kohei Yorita 12/41
Transfer Function performance Comparisons between (CDF sim.) and (CDF sim.+Transfer function) dependence 2jets W mass 3jets Top mass Pt dependence Mtop Mtop CDF sim. CDF sim. CDF sim.+TF. CDF sim.+TF. Mw Mw Input top : 175 GeV Input W : 80.4 GeV Means are back to inputs and RMS gets better after TF. June 11th , 2004 FNAL W&C Seminar - Kohei Yorita 13/41
Transfer function Top Mass dependence Plots: Mean of as a function of Et of jets. b jets w jets bjet has the top mass dependence. We use the transfer function obtained from Mtop=175 GeV . June 11th , 2004 FNAL W&C Seminar - Kohei Yorita 14/41
Monte Carlo signal studies 22 events Pseudo expts using Mtop = 175 GeV sample Center of pull is consistent with 0. Width is consistent with 1.0. Default Slope : 0.83 Transfer function from 175 GeV. Different Mass sample Due to mass dependence of TF. Use this slope to get input mass. Signal only mapping slope ! Q: Is this really coming from only TF? A: Yes, checked, Use Transfer function at each mass. ex) 160 GeV sample 160 GeV TF. Slope : 0.98 June 11th , 2004 FNAL W&C Seminar - Kohei Yorita 15/41
Pull distributions(signal only) Outputs from 1000 sets of 22 signal events pseudo expts. after the correction to each set. Center of Pull Width of Pull By taking into account the slope as a mapping function, top mass can be reconstructed correctly, no input mass bias for the center and width. In fact,………Go next slide. June 11th , 2004 FNAL W&C Seminar - Kohei Yorita 16/41
Test Using Blind Samples madeby CDF top mass group • Six top mass samples: generated with randomly selected top masses using Herwig or Pythia. (200k events each). • For users: unknown ( top mass, Herwig or Pythia) known (no backgrounds, masses are in reasonable range) A B C D E F Error stat only DLM promises no biases and good performance(<1.0 GeV)! June 11th , 2004 FNAL W&C Seminar - Kohei Yorita 17/41
Very Short Summary on the way… • So far, We have studied Signal Monte Carlo and got reasonable results without bias by correcting transfer function mass dependence. • Let’s move to a treatment of the backgrounds. We need to understand the background effects on signal likelihood distribution. June 11th , 2004 FNAL W&C Seminar - Kohei Yorita 18/41
Background Estimate In the method, first, all events are assumed to be signal. Need correct background effect. Counting Method Publication of this result coming soon. The background fraction is estimated to be 19 ± 5 % June 11th , 2004 FNAL W&C Seminar - Kohei Yorita 19/41
Understanding of background ~ Likelihood Distributions ~ Parton Level CDF simulation Typical –2ln(likelihood) distributions for signal and backgrounds. background background Peak : Backgrounds : lower mass Signal : input mass Absolute value of likelihood in signal is much larger than that in background Signal Signal:175GeV We expect the background makes likelihood peak down when it is multiplied to signal events. June 11th , 2004 FNAL W&C Seminar - Kohei Yorita 20/41
Background Effects Details Reconstructed mass from 22 events Pseudo expts. by varying background fraction. Reconstructed Mass Shift due to each background source. Mt=175 signal sample is used and Background Numbers are Poisson fluctuated. Mass is shifted lower by background increase. Resolution also gets worse. The size of shift is different in each source. But W+LF(mistag), QCD and Wbb(>80%) have similar behavior. June 11th , 2004 FNAL W&C Seminar - Kohei Yorita 21/41
The Mapping Function Mass dependent correction factor. The mapping function is obtained from 2000 sets of 22 events(fixed) pseudo experiments in each point, by varying the background fraction with Poisson distributed. The background estimate in our sample is 19%. Parameterization of the slope and the constant of the fit Slope Constant June 11th , 2004 FNAL W&C Seminar - Kohei Yorita 22/41
How to apply the mapping function? Input : (1) Reconstructed Mass & Error from the sample (2) Background fraction in the sample Example (1) (2) * Statistical errors are also scaled by the slope properly. Extract the top mass June 11th , 2004 FNAL W&C Seminar - Kohei Yorita 23/41
Pull distribution ofS:17.8ev + B:4.2ev = 22 events Plots after applying the mapping function of 19% background to each output mass . Center of Pull Width of Pull No bias ! Even if the sample includes backgrounds. June 11th , 2004 FNAL W&C Seminar - Kohei Yorita 24/41
Extracted top mass from RunII Observed :Total 22 events; electrons 12, Muons 10 Correct background-pulling 4.2 events expected. Fit : Two 2nd order polynomials for positive/negative errors. June 11th , 2004 FNAL W&C Seminar - Kohei Yorita 25/41
Expected statistical uncertainties Before Mapping function applied Black arrows : Data + 3.4, – 3.8 GeV Mean : + 4.2, – 3.8 GeV MPV : + 3.5, – 3.2 GeV After Mapping function applied Black arrows : Data + 4.5, – 5.0 GeV Mean : + 5.4, – 5.0 GeV MPV : + 4.5, – 4.1 GeV Stat. error is scaled by ~30% , due to the mapping slope. June 11th , 2004 FNAL W&C Seminar - Kohei Yorita 26/41
Jet Energy uncertainty Jet Energy Scale Shift for one of part of JES. uncertainty Transfer Function “Jets Parton Probability density” • Took out-of-cone corrections uncertainty for fragmentations, 1.6 GeV • Hadronization model is already included in generator systematics. • Correlated ISR/FSR, jet smearing 15%. • It is very hard to validate whether the shape of transfer function in MC • can represent that of data correctly. We will continue the works by doing, • (1) hadronic W mass, (2) Z bb, (3) bjet-gamma balance e.t.c • For now, we take 2.0 GeV error to be conservative. June 11th , 2004 FNAL W&C Seminar - Kohei Yorita 28/41
ISR/FSR uncertainty We checked several ways such as On/Off, diff s , RunI like. ISR (Initial State Radiation) We have now the following two samples set the parameters range by comparing with Drell-Yan data. More ISR : QCD = 384, K = 0.5 Less ISR : QCD = 100, K = 2.0 Run I: no ISR: K = infinite ISR systematic : 0.5 GeV FSR (Final State Radiation) More FSR : QCD = 384, K = 0.5 Less FSR : QCD = 100, K = 2.0 FSR systematic : 0.5 GeV June 11th , 2004 FNAL W&C Seminar - Kohei Yorita 29/41
Parton Distribution Function PDF General Add in quadrature the following, (1) CTEQ6M 20 pairs of eigenvectors (2) Two different s with MRST (3) CTEQ5L vs MRST PDF systematic : 2.0 GeV NLO vs LO PDF PDF :gg 15%(NLO), 5%(LO) We reweight gg contribution to 15%(NLO) from 5%(LO). This makes a difference of 0.4 GeV. NLO PDF effect : 0.4 ± 0.2 GeV June 11th , 2004 FNAL W&C Seminar - Kohei Yorita 30/41
Other Systematic uncertainties Generator Background Modeling 0.5 GeV 0.6 ± 0.2 GeV Pythia and Herwig (also checked Grappa, 0.6 GeV) Spin correlations (Herwig) We ignore spin corr.matrix element in the likelihood. On/Off difference is 0.7 GeV Background Fraction 0.5 GeV 0.4 ± 0.2 GeV Error due to 19±5% Additional jet smearing Resolution underestimated in our MC Additional 15% gives 0.6 ± 0.2 GeV Unclustered Energy 0.1 ± 0.2 GeV The effect of difference for Unclustered calorimeter energy June 11th , 2004 FNAL W&C Seminar - Kohei Yorita 31/41
Systematics Summary Dominated by Jet Energy Scale. Improvements by a better understanding of our simulation i.e. calorimeter response will be coming very soon. More understanding of transfer function will reduce the error. Avoid both under/over estimate.(correlations) June 11th , 2004 FNAL W&C Seminar - Kohei Yorita 32/41
CDF RunII Preliminary Results Summary Lepton+jets (btag) Dilepton +7.1 –7.7 +6.4 –6.3 +4.5 –5.0 +17.4 –16.9 177.8 ±6.2 175 ± 8.4 174.9 ±6.5 179.6 ±6.8 : Monte Carlo Currently DLM is the most precise measurement in RunII. : Data June 11th , 2004 FNAL W&C Seminar - Kohei Yorita 33/41
More checks of MC vs Data (1) Event likelihood For i-th event, An event has one likelihood. Although absolute value does not have any meaning, we can compare Monte Carlo with Data directly. Agreement is quite good ! More likely to be background June 11th , 2004 FNAL W&C Seminar - Kohei Yorita 34/41
More checks of MC vs Data (2) How about Maximum likelihood mass in each event? (gives us shape information!) Maximum Likelihood mass in each event from MC . Comparison between MC and Data. Signal RMS : ~22 GeV cf) Template: ~30 GeV June 11th , 2004 FNAL W&C Seminar - Kohei Yorita 35/41
Conclusions and Plans Top Mass Results • From 22 events with 4.2 event background • (162 pb-1), We measured top mass by DLM to be, 4.5 5.0 Mtop = 177.8 ± (stat.) ± 6.2 (syst.)GeV/c2 • Currently, this is the most precise measurement using • RunII data. +7.7 –8.0 Cf) world average : 1784.3 (2.73.3) GeV/c2 Total: GeV/c2 Things to do -- Reduce systematics (JES!) -- Hadronic W mass measurement in this channel. -- Get more data. DLM is a very powerful method which can test both the Standard model and beyond. June 11th , 2004 FNAL W&C Seminar - Kohei Yorita 36/41
More comments on DLM (1) In principle, 1. Normalization, N(y) gives no effect on top mass measurement. constant 2. Phase space, d : assume that each final state parton occupies a unit phase volume in each event. (1) June 11th , 2004 FNAL W&C Seminar - Kohei Yorita 38/41
Comparisons between DLM and DOM(RunI) ~ These two Method look very similar, but Not identical! ~ DLM : DOM : June 11th , 2004 FNAL W&C Seminar - Kohei Yorita 39/41
More on backgrounds 5 events pseudo experiment using only each background source Mistag Single top Wcc (Wbb/nonW) (Wc/WW) Max. likelihood mass in each event Mapping slope June 11th , 2004 FNAL W&C Seminar - Kohei Yorita 40/41
How Likelihood looks like? 25 events examples using generator level input Signal example: - log(likelihood) Bkg example: - log(likelihood) Blue : all added up Black : each comb. Blue : all added up Red : right comb. Black : wrong comb. Range[155-195]GeV Likelihood tends to be higher in lower mass region. Peak around 175 GeV June 11th , 2004 FNAL W&C Seminar - Kohei Yorita 41/41