Download
1 / 30
300 likes | 304 Views
This study conducted by Utah State University aims to estimate the survival of juvenile Greater Sage-grouse in Utah. The study examines various factors such as predation, hen behavior, vegetation, and arthropod population. Results indicate that predation is a major cause of mortality, but overall survival is good. The study also suggests that brood-mixing and arthropods may play a role in chick survival.

E N D
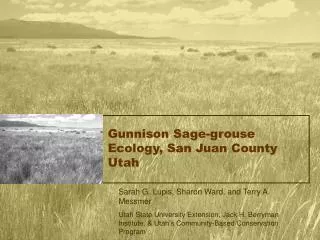
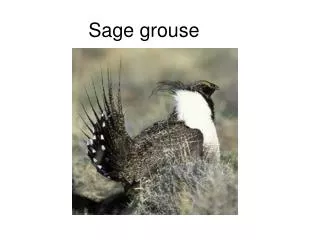
Estimating Greater Sage-grouse Juvenile Survival in Utah Utah State University David Dahlgren Terry Messmer David Koons
Introduction • Info Need
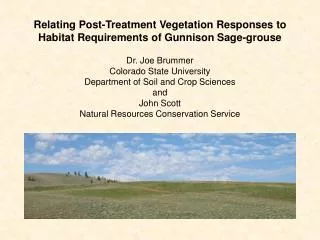
Study Area • Parker Mountain
Methods • Hen Behavior
Methods • Monitoring
Methods • Veg and Arthropod Sampling
Methods • Cause of mortality • Handling • Exposure • Predation • Avian/Mammalian • Unknown
Methods • Modeling • Manly and Schmutz 2001 - JWM • Maximum Likelihood Estimation (Version of the Mayfield Estimator) • Heterogeneity - D
Methods • Modeling Survival • First • Age Structure (weeks 1 to 6) • Used to assess covariates • AIC • Second • Assess covariates • Temporal • Brood hen characteristics • Vegetation data • Arthropod data
Methods • Modeling Survival • Assumptions • Brood-mixing and right censoring • Missing chicks • Brood-mixing and missing chicks
Methods • Modeling Survival • First Covariates • Year • Brood Type • Hen Behavior (restricted data set) • Hen Age (restricted data set) • Hatch Date
Methods • Modeling Survival • Second – Vegetation Covariates (restricted data set) • Shrub cover and height • Grass cover and height • Forb cover and height • Third – Arthropod Covariates (2006, restricted data set) • Hymenoptera (ants separate), Coleoptera, Lepidoptera, Orthoptera, miscellaneous, and total arthropods
Results • Sample sizes • Total • 2005 n = 89 chicks in 21 broods (mean = 4.24) • 2006 n = 61 chicks in 21 broods (mean = 2.91) • Handling Death (2.6%) • 2005 n = 3 • 2006 n = 1 • Excluded from the survival analysis
Results • Sample Sizes • Chick mass • Mean = 29.5g (SE = 0.16) • Transmitter averaged 5.1% (SE = 0.0003) of chick weight • Hen Behavior • 43% Very protective (18/42) • 38% Moderately protective (16/42) • 19% Non-protective (8/42)
Results • Sample Sizes • Brood Mixing • 21% of marked chicks (31/146) • 43% of marked broods (18/42) • 45% of mixing events involved >1 chick (9/20) • Occurred weeks 1 to 6 • 70% (14/20) in weeks 2 and 3 • Radio-marked hen mortality (n = 2)
Results • Sample Sizes • Chick Mortality • n = 44 documented deaths • n = 26 missing (assumed depredated) • n = 6 exposure • Predation 91% (64/70) • Unknown 75% (48/64) • Mammalian 12.5% (8/64) • Avian 12.5% (8/64)
Results First – Age parameterization Second – Temporal and hen characteristics : AIC difference between a model (i.e., model i) and the best performing model (i.e., model with the lowest AIC among the set of models examined). wi: Akaike model weight. * The best model of age = (week1) + (week2) + (week3) + (week4) + (weeks5-6)
Results First – Age parameterization
Results Second – Temporal and hen characteristics
Results Mean Survival to 42 days = 0.41 (SE =0.046) Chick Survival in Regular broods = 0.38 Chick Survival in Mixed broods = 0.61
Results • Heterogeneity (D) • Chicks/brood = 3.5 • For best model • D = 1.10 (SE = 0.22)
Results • Vegetation Covariates • Null Model is best
Results • Arthropod Covariates • Entire 42 days • Ant model
Results • Arthropod Covariates • Early brood-rearing (day 1-21) • Orthoptera (grasshopper) model • Estimates not significant
Take Home • Predation major cause of chick mortality • However, survival was good (mean = 0.41) • Our data suggested low dependence among brood mates for sage-grouse chicks • Brood-mixing may be important to survival, needs further investigation • There is evidence that Arthropods (especially Orthoptera) may aid chick survival, needs further investigation (> sample size)
Thanks People • Technicians • Nathan Burkepile • Jack Connelly • Volunteers PARM • USU Extension • Parker Mtn. Grazing Association • Jack H. Berryman Institute • UDWR • USFS • BLM • NRCS • SITLA • Farm Bureau • County Commissioners
Any Questions?