Download

1 / 34
340 likes | 343 Views
Learn how to accurately measure the return on investment (ROI) of IT expenditures and understand the impact on business revenue. Avoid underestimating affected processes and assumptions, and consider the costs and savings involved. This analysis will help uncover the association and causation between IT costs, usage, and revenue, ultimately enabling businesses to optimize their ROI.

E N D
Farrokh Alemi, Ph.D. Return on IT investment
Morgan Stanley: “US firms lost $130 billionin unwanted IT” The problem is with our methods Not mismanagement
List of Costs & Savings • Underestimates affected business processes • Assumes IT increases revenue • Assumes unused is saved costs • Training & maintenance costs ignored • Impact on productivity and quality ignored
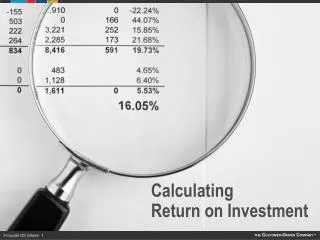
Steps in Proposed Analysis • Gather data over at least 3 periods • Money spent on IT • Use of IT by the business unit • Organization’s or business unit’s revenues • Examine association between IT cost, use and revenue • Often positive and significant • Examine causation • Revenue leads to IT use and investment • IT investment and use leads to more revenue • Calculate ROI
Steps in Proposed Analysis • Gather data over at least 3 periods • Money spent on IT • Use of IT by the business unit • Organization’s or business unit’s revenues • Examine association between IT cost, use and revenue • Often positive and significant • Examine causation • Revenue leads to IT use and investment • IT investment and use leads to more revenue • Calculate ROI
Steps in Proposed Analysis • Gather data over at least 3 periods • Money spent on IT • Use of IT by the business unit • Organization’s or business unit’s revenues • Examine association between IT cost, use and revenue • Often positive and significant • Examine causation • Revenue leads to IT use and investment • IT investment and use leads to more revenue • Calculate ROI
Steps in Proposed Analysis • Gather data over at least 3 periods • Money spent on IT • Use of IT by the business unit • Organization’s or business unit’s revenues • Examine association between IT cost, use and revenue • Often positive and significant • Examine causation • Revenue leads to IT use and investment • IT investment and use leads to more revenue • Calculate ROI
Steps in Proposed Analysis • Gather data over at least 3 periods • Money spent on IT • Use of IT by the business unit • Organization’s or business unit’s revenues • Examine association between IT cost, use and revenue • Clear relation in scatter diagram • Large pair wise correlation • Examine causation • Revenue leads to IT use and investment • IT investment and use leads to more revenue • Calculate ROI
Steps in Proposed Analysis • Gather data over at least 3 periods • Money spent on IT • Use of IT by the business unit • Organization’s or business unit’s revenues • Examine association between IT cost, use and revenue • Clear relation in scatter diagram • Large pair wise correlation • Examine causation • Revenue leads to IT use and investment • IT investment and use leads to more revenue • Calculate ROI
Steps in Proposed Analysis • Gather data over at least 3 periods • Money spent on IT • Use of IT by the business unit • Organization’s or business unit’s revenues • Examine association between IT cost, use and revenue • Clear relation in scatter diagram • Large pair wise correlation • Examine causation • Revenue leads to IT use and investment • IT investment and use leads to more revenue • Calculate ROI
Steps in Proposed Analysis • Gather data over at least 3 periods • Money spent on IT • Use of IT by the business unit • Organization’s or business unit’s revenues • Examine association between IT cost, use and revenue • Clear relation in scatter diagram • Large pair wise correlation • Examine causation • Revenue leads to IT use and investment • IT investment and use leads to more revenue • Calculate ROI
Steps in Proposed Analysis • Gather data over at least 3 periods • Money spent on IT • Use of IT by the business unit • Organization’s or business unit’s revenues • Examine association between IT cost, use and revenue • Often positive and significant • Examine causation • Revenue leads to IT use and investment • IT investment and use leads to more revenue • Calculate ROI
Steps in Proposed Analysis • Gather data over at least 3 periods • Money spent on IT • Use of IT by the business unit • Organization’s or business unit’s revenues • Examine association between IT cost, use and revenue • Often positive and significant • Examine causation • Revenue leads to IT use and investment • IT investment and use leads to more revenue • Calculate ROI
Steps in Proposed Analysis • Gather data over at least 3 periods • Money spent on IT • Use of IT by the business unit • Organization’s or business unit’s revenues • Examine association between IT cost, use and revenue • Often positive and significant • Examine causation • Revenue leads to IT use and investment • IT investment and use leads to more revenue • Calculate ROI
Steps in Proposed Analysis • Gather data over at least 3 periods • Money spent on IT • Use of IT by the business unit • Organization’s or business unit’s revenues • Examine association between IT cost, use and revenue • Often positive and significant • Examine causation • Revenue leads to IT use and investment • IT investment and use leads to more revenue • Calculate ROI
Steps in Proposed Analysis • Gather data over at least 3 periods • Money spent on IT • Use of IT by the business unit • Organization’s or business unit’s revenues • Examine association between IT cost, use and revenue • Often positive and significant • Examine causation • Revenue leads to IT use and investment • IT investment and use leads to more revenue • Calculate ROI
Steps in Proposed Analysis • Gather data over at least 3 periods • Money spent on IT • Use of IT by the business unit • Organization’s or business unit’s revenues • Examine association between IT cost, use and revenue • Often positive and significant • Examine causation • Revenue leads to IT use and investment • IT investment and use leads to more revenue • Calculate ROI
Steps in Proposed Analysis • Gather data over at least 3 periods • Money spent on IT • Use of IT by the business unit • Organization’s or business unit’s revenues • Examine association between IT cost, use and revenue • Often positive and significant • Examine causation • Revenue leads to IT use and investment • IT investment and use leads to more revenue • Calculate ROI
Steps in Proposed Analysis • Gather data over at least 3 periods • Money spent on IT • Use of IT by the business unit • Organization’s or business unit’s revenues • Examine association between IT cost, use and revenue • Often positive and significant • Examine causation • Revenue leads to IT use and investment • IT investment and use leads to more revenue • Calculate ROI
Steps in Proposed Analysis • Gather data over at least 3 periods • Money spent on IT • Use of IT by the business unit • Organization’s or business unit’s revenues • Examine association between IT cost, use and revenue • Often positive and significant • Examine causation • Revenue leads to IT use and investment • IT investment and use leads to more revenue • Calculate ROI
Investment In DoIT Numerous units were merged into DoIT in this time period. DoIT organization defined based on 2002 operation and budget reconstructed.
Example: Evaluation of DoIT The Division of Instructional & Technology Support Services includes: • Audio Visual Services • Academic Computing Labs, • Electronic Classrooms, • GMU-TV, • Instructional Resource Center, • Johnson Center Technology • Student Technology Assistance Resource Center. A key service provided by DoIT is the WebCT course delivery system
Take Home Lesson Objective ROI