Download
1 / 66
670 likes | 677 Views
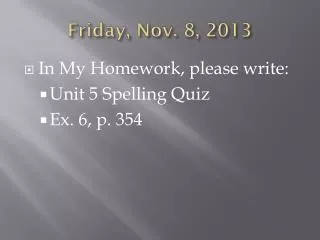
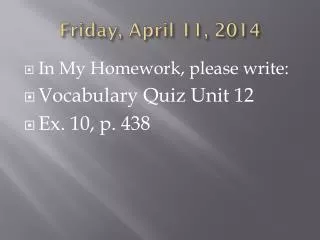
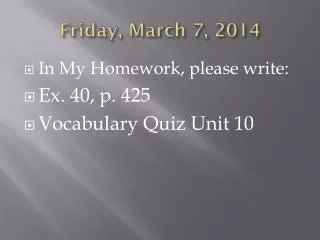
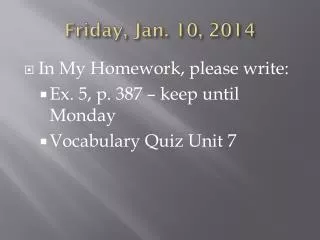
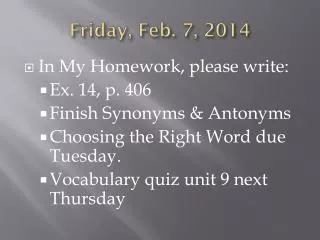
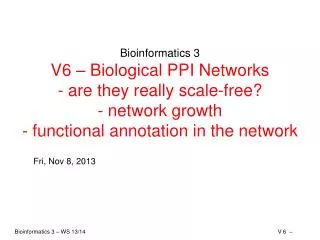
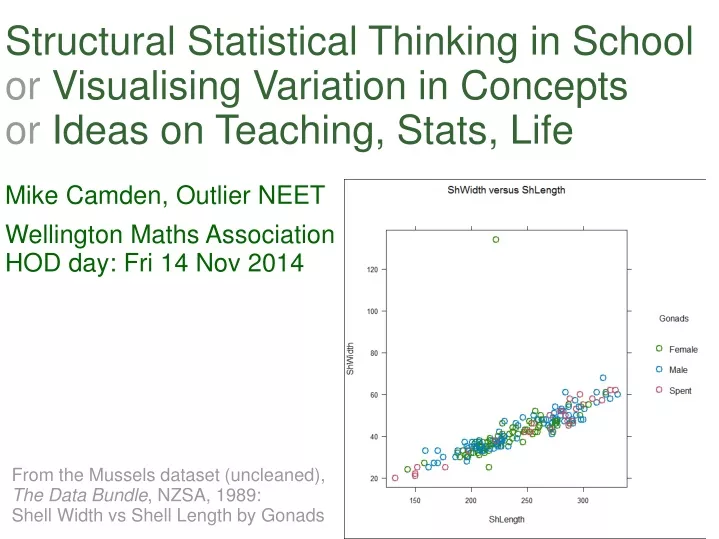
Mike Camden, Outlier NEET Wellington Maths Association HOD day: Fri 14 Nov 2014. Structural Statistical Thinking in School or Visualising Variation in Concepts or Ideas on Teaching, Stats, Life. From the Mussels dataset (uncleaned), The Data Bundle , NZSA, 1989:

E N D
Mike Camden, Outlier NEET Wellington Maths AssociationHOD day: Fri 14 Nov 2014 Structural Statistical Thinking in Schoolor Visualising Variation in ConceptsorIdeas on Teaching, Stats, Life Fromthe Mussels dataset (uncleaned), The Data Bundle, NZSA, 1989: Shell Width vs Shell Length by Gonads
To clarify some structures that underly stats in schools To make your jobs easier Aims My current interest: Structural thinking Conceptual structures Your current needs concerns My current concern: centrally important career roles: Statistical thinking Statistical educating Do you mind if I ask a few questions? They'll look like this.
Outliers: NEETs, mussels A three-point time series from NZ statistical education history Structures for concepts And the central structures for us With a hands-on activity: case data More situations with structures Concluding reflections With a hands-on activity: series data Structure of the session
NEET = Not in Employment, Education, or Training NEETs and an outlier NEET http://en.wikipedia.org/wiki/NEET
The Data Bundle, NZSA,1989, contained The mussels data, on 'horse mussels', Atrina, Marlbrough Sounds. It originally contained: Mussels and an outlier mussel Does anything hit you in the eye? What do we do about it? Atrina zelandica Kukuroroa, Kupa, Hururoa Horse or fan mussels Into Quota Management 2004
How many variables? Numerical, categorical? The mussels and data visualisation With outlier Without outlier, enhanced
1965 A few statistical enthusiasts work in govt agencies and universities 1985 A group of NZSA members realise that computing makes EDA accesible to students 2005 A bigger group, now the NZSA Education Committee, realise that computing makes resampling methods accessible to students A time series with 3 points
One dimensional with one level of classification with two levels of classification with three levels of classification etc Two dimensional with one level of classification for each with one and two levels of classification with two and two levels of classification Etc Three dimensional with one level of classification for each Etc Etc Several dimensions, listed separately And lots more! Structures for a set of concepts can be lists:
Venn diagrams Networks Classification trees, taxonomies Tables, matrices Flowcharts Concept maps, conceptual models, mind maps Theoretical frameworks, schema Sets of definitions and standards The SOLO taxonomy Lots more Most of them use the 2D world of surfaces, which belongs to us geometricians Related tools for structural thinking
The literature: Sharleen Forbes and Denise Brown on Conceptual thinking in national statistical offices Everyone else: Ignored! My experience for the last 12 years: I hope it transfers from here to here The literature on structural thinking and my experience
Sharleen Forbes, Denise Brown; Statistics NZ. Statistical Journal of the IAOS 28 (2012).http://isi.cbs.nl/IAOS/ IAOS = International Association for Official Statistics From Stats NZ studies: skill gaps included: conceptual thinking (or lack of) Conceptual skills: ability to: look at identify label organise understand interrelationships of ideas objects events Conceptual thinking in national statistics offices
The statistical enquiry cycle The 2 (or more) types of dataset The 2 (or more) types of variable The 2 (or more) purposes for data graphics Two familiar structures: Curriculum and NCEA The number of variables to examine together Examining 1 variable Examining 2 variables, with Activity 1 Examining 3 or more variables How software structures our thinking A guided tour of statistical structures: the MOOC: https://www.futurelearn.com/courses/data-to-insight Chris Wild’s Data to Insight: An Introduction to Data Analysis MOOC = Massive Open Online Course The main structures for us
Embedded in NZ Curriculum . Stat investigations, L1 to 8 Takes shape as: Deming cycle: (stat quality assurance) PPDAC cycle: Poster courtesy of CensusAtSchool New Zealand www.censusatschool.org.nz Official Stats: the gBPM: The Generic Statistical Business Process Model -> http://www1.unece.org/stat/platform/display/metis/The+Generic+Statistical+Business+Process+Model The statistical enquiry cycle: we are not alone! Plan Act Do Check, Study
The Generic Statistical Business Process Model: From the UN Economic Commission for Europe:
The obvious 2 types are: Case, cross-sectional datasets Time series (or just series) datasets Questions: What is so special about series datasets? Why AS91580? What's another sort of dataset?? What is your favourite software, and How does it make you separate the 2 sorts? The 2 (or more) types of dataset
What is so special about series datasets? We have an explanatory variable, And its values are equally spaced Scatterplots become series plots, And we join the dots What's another sort of dataset?? Longitudinal datasets They're everywhere! What is your favourite software, iNZight; and How does it make you separate the 2 sorts? TS are in 'advanced' Answers (for Achieved)
Variables can be: Categorical Numerical Restricted to integers Not restricted to integers Restricted to non-negative Not restricted to non-negative How does your favourite software deal with these 2 types? The 2 (or more) types of variable Categorical variables Numerical variables
The 2 (or more) uses for data graphics Graphics used for exploration, to find the stories Graphics used for communication, to tell the stories If students realise that, does it help? Examples ->
Exploration: Quakes data (GNS; 2000): 6 variables: From GNS Science: http://www.gns.cri.nz/ 334 quakes magnitude 4 or more. Year 2000. Scatterplot matrix via iNZight's Advanced Quick explore Pairs. All 2-variable relationships.
Depth vs Easting, Northing, by NorMidSth (South on left) via iNZight's Advanced 3D plot Exploration?: Quakes data: 4 variables:
Depth vs Easting, Northing, by NorMidSth (Nor near). via iNZight's Advanced 3D plot Next step: Fix scales Communication?: Quakes data: 4 variables:
A familiar structure:from NZ Curriculum: One-level variable One-level variable One-level variable One-level variable With a kink Two-level variable From NZ Curriculum Mathematics and Statistics learning area
For a dataset with several vars, k can be: k = 1 Is this our business? 2 Is this our business? 3 Do we ever do this? 4 Do we need to stop somewhere? more Does the software let you do stuff here? Eg: from the quakes dataset: The number of variables, k, to examine together
A dataset has 3 vars: a b c We can examine features using: 0 vars Nothing! Just count the records, to get n 1 1 var 'univariate' 3 a b c 2 vars 'bivariate' 3 ab bc ca 3 vars hmmmmm 1 abc How many options in each group? How many altogether? 8 What happens with m variables? (Say m = 4 or 5) Does anyone still like perms and coms?
What goes in the boxes? Examining 1 variable: a subset of the structure, with dimensions swapped:
What goes in the boxes? Examining 1 variable: a subset of the structure:
Examining 1 variable: an attempt: Courtesy of iNZight: Distribution of Felt: Distribution of Depth:
We assume they are x, explanatory, independant y, response, dependant The structure of possible pairs looks like: Examining 2 variables: Activity 1 of 2 But we need another dimension and another layer for AS's: What methods go in the boxes? What Achievement Standards fit in the boxes?
Courtesy of iNZight: Advanced, Quick Explore, Pairs: Examining 2 variables: attempt 1: Achieved: pictures:
Do they fit in here? Where? Hey! Time series!
Here? With: well-behaved (equally spaced) x values (usually) numerical y variables; lots of them lots of series graphs models fitted by smoothers not algebraic expressions Time series do fit in:
From Data Bundle: Mussels: How many variables? How many Numerical? Categorical? Examining 3 or more variables: an example:
Traditional command-driven software: R, SAS, … Traditional menu-driven software: Genstat for Teaching and Learning, SAS EG, Minitab, SPSS, R Commander, NZGrapher, ... Spreadsheet software: Open Office, XL, … Super-friendly software: TinkerPlots, iNZight, NZGrapher, … How do they let us into our structure? Structures in the software:
iNZight takes us ... from data (the variables) to graphics to inference iNZight recognises the variables as: Categorical, Numerical does the appropriate graph offers appropriate analysis options to summaries and models
iNZight does not disinguish Software and the structure of PPDAC's 'Analyse' SAS EG etc: iNZight etc: i
Statistical paradigms Related disciplines and their software Liveliness of data graphics Taxonomies Tensions: conflicting needs, and how to conceptualise them Student reports Stats NZ's longitudinally linked census project More situations with structures
Statistical paradigms: two of them: thanks to Vic Duoba, Stats NZ Leo Breiman. Statistical modelling: the two cultures. Statistical Science, 2001, v16 n3. Which culture are we in, at present? What does our future hold?
Exploratory data analysis Data visualisation Geospatial systems Data analytics Visual analytics Predictive analytics Knowledge warehousing Data mining, machine learning Data science 'Statistical data visualisation' as in Mondrian http://www.theusrus.de/Mondrian/ http://www.amazon.com/Interactive-Graphics-Analysis-Urbanek-Hardcover/dp/B00E2RM2E4 Our PPDAC cycle, EDA, and inference methods support all that Related disciplines and their software DV EDA
Data graphics can be: Static Interactive Dynamic Egs from Stats NZ: Static: Heaps of them! Interactive: http://www.stats.govt.nz/browse_for_stats/people_and_communities/Well-being/nzgss-2012-interactive-tool.aspx Dynamic: http://www.stats.govt.nz/populationpyramid2/NZPopulationPyramid.html Do interactive and dynamic software tools have a place in learning and assessment? Liveliness of data graphics: don't forget:
Source: Stats NZ:http://www.stats.govt.nz/methods/classifications-and-standards/classification-related-stats-standards/language.aspx Classifications, trees, taxonomies; example: Language
Egs from Official Stats, with 2 variables: Confidentiality for respondents vs utility of output: Data richness vs respondent burden Tensions: how to conceptualise them The goal Hi Safety Lo Raw data Lo Utility Hi
Methods for writing reports: A A: Type your stream of consciousness very fast B: Think, talk, draft with a pencil, write the contents list (the structure), construct the contents. B Do you give guidance on how to write reports? What's your preference: A or B? Structure in student reports
The project: Clarified the linkable population for each pair Linked a proportion of these Produced concordances for each (neighbouring) pair A challenge: Structure of confidentiality rules for output Didham, R, Nissen, K and Dobson, W (2014). Linking censuses: New Zealand longitudinal census 1981–2006. Available from www.stats.govt.nz. ISBN 978-0-478-42907-7 (online). July 2014. Statistics New Zealand. http://www.stats.govt.nz/methods/data-integration/data-integration-projects/linking-censuses-nzlc-1981-2006.aspx Stats NZ's Longitudinally Linked Census project: 1 of 2 Link rate: 70.3% Treat as: Full-coverage data? Sample data? Link rate: 31.5%
Structures in statistical thinking Wild and Pfannkuch 1999 Activity 2: Practicing stat thinking on Births Concluding reflections The end is nigh:
The four dimensional framework: The investigative cycle Problem Plan Data Analysis Conclusions … Types of thinkingData Transformation Variation Models Context The interrogative cycleGenerate Seek Interpret Criticise Judge … DispositionsScepticism Imagination Curiosity Openness Depth Logic Engagement Perseverance Wild , C. J. and Pfannkuch, M. (1999). Statistical thinking in empirical enquiry. International Statistical Review, 67, 223- 265. The 4D structure for Statistical Thinking Maxine and Chris, 1999:
Real births average 4,767.6/month. Assume: rate is constant over the 408 months births are independent of each other We get: BirthsPoisson BirthsReal's variation contains what features? Data from Stats NZ Infoshare Graphics from iNZight: Advanced, Time Series Practicing Stat Thinking:Stats NZ's Births per month: exploring the structure of its variationActivity 2 of 2
What features does BirthsReal's variation contain now? Data from Stats NZ Infoshare Graphics from iNZight: Advanced, Time Series Stats NZ's Births per month: after dividing by MonthLength