Download
1 / 22
220 likes | 241 Views
Learn about the basics of ecosystems, the structure, interdependence, and problems faced, including biomagnification and consequences of environmental impacts.

E N D
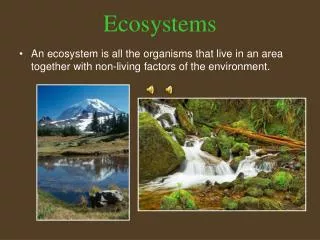
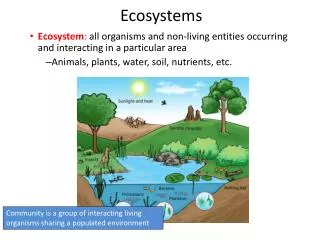
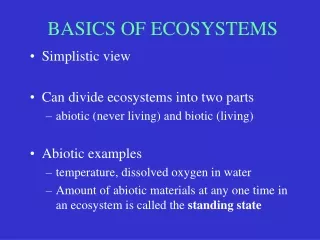
BASICS OF ECOSYSTEMS • Simplistic view • Can divide ecosystems into two parts • abiotic (never living) and biotic (living) • Abiotic examples • temperature, dissolved oxygen in water • Amount of abiotic materials at any one time in an ecosystem is called the standing state
Biotic material • could conceive of three structural parts • Producer organisms (autotrophic) • Consumer organisms (heterotrophic) • Primary, Secondary, Tertiary • Decomposer organisms • Leads into a discussion of trophic structure • food webs, food pyramids, food chains • The total amount of living material in a tropic structure is termed the biomass
PROBLEMS FROM THE STRUCTURE OF ECOSYSTEMSInterdependence • Each level within the structure is called a trophic level • relationships between species and trophic levels • what impacts on one will be spread to others • systems interlink as well
PROBLEM • Island of Mauritius • Calvaria Tree - valuable as a hardwood and linked to exports • Number of trees diminishing in the system • Assumption of overcutting • Last 13 trees protected but would not reproduce (youngest tree 300 yrs old) • Seed hulls too thick for plant to germinate
NORTH BORNEO 1955 Spray with Dieldrin to kill mosquitoes carrying malaria Malaria declines Spray kills wasps and insects which feed on caterpillars Caterpillars increase and eat through thatched roofs Roofs fall in
Spray also kills flies and cockroaches Cats eat dead lizards and die Insect eating lizards die Sylvatic plague carried by fleas on rats increases Rat population increases Rat population declines WHO parachutes in cats Plague declines
Canadian Forests threatened by spruce budworm spray Kills other species ie bees Spread to water systems Possible link to Reye’s Syndrome NOTE: TEMPORAL & SPATIAL SEPARATION
Decreasing Biomass with Pyramid Shape • Amount of biomass at higher trophic levels is less than that below it • The conversion of energy uses energy (feeding, digestion, movement, etc) • On average there is a 90% loss when energy is transferred from one level to the next
Theoretical pyramid Note: At higher levels could be 99%+ loss
Consequences • If a lower level is affected it will have a more significant effect (%) on the lesser biomass above • Species at the top are more vulnerable to change as the populations are smaller
Biomagnification • Sometimes referred to as ‘funneling’ • If materials added to the system do not break down into their component parts they will ‘move up’ the pyramid • Because of energy loss there is less biomass to absorb the material • This means that the concentration levels increase in the members of species further up the food chain
CONSEQUENCES • Humans are at the top of some food chains • Mercury, for example, can be found in Minimata, Japan or in the English River in Ontario
The Minamata Disease got its name from Minamata Bay in Southwestern Japan where it was first observed in nearby communities. It was officially discovered in 1956, and a few years later it was known to be caused by ingestion of fish that had been contaminated by mercury let off from a chemical manufacturing plant. Levels of methylmercury chloride were very high: up to 50 ppm in fish and 85 ppm in shellfish from the contaminated areas. 121 people were poisoned from eating the contaminated fish, 46 of which died. Dogs, cats, pigs, rats, and birds that were living around the bay also showed the signs of mercury poisoning, and many died. • The initial symptoms were numbness of the limbs and the area around the mouth, sensory disturbance, and difficulty with everyday hand movements. Also there occurred a lack of coordination, weakness and tremor, slowed and slurred speech, and altered vision and hearing. These symptoms worsened and led to general paralysis, involuntary movements, difficulty in swallowing, convulsions, brain damage, and death.
Between 1962 and 1970, a pulp mill operated by Dryden Chemicals dumped about 9,000 kilograms of mercury into the English-Wabigoon river system. Both communities sit along the 480-kilometre system, which runs across the Ontario-Manitoba border. • Testing showed people had high levels of mercury in their blood, which was blamed for birth defects in children. • In the mid-1980s, the bands received a compensation package of almost $17 million from the company and provincial and federal governments. • They're still advised not to eat fish from the river.