Download
1 / 58
580 likes | 723 Views
Data Mining and OLAP. University of California, Berkeley School of Information IS 257: Database Management. Review Applications for Data Warehouses Decision Support Systems (DSS) OLAP (ROLAP, MOLAP) Data Mining Thanks again to lecture notes from Joachim Hammer of the University of Florida

E N D
Data Mining and OLAP University of California, Berkeley School of Information IS 257: Database Management
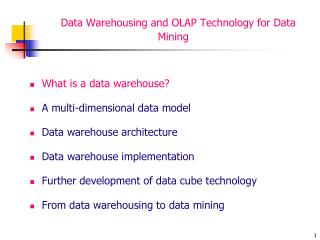
Review Applications for Data Warehouses Decision Support Systems (DSS) OLAP (ROLAP, MOLAP) Data Mining Thanks again to lecture notes from Joachim Hammer of the University of Florida More on OLAP and Data Mining Approaches Lecture Outline
Knowledge Discovery in Data (KDD) • Knowledge Discovery in Data is the non-trivial process of identifying • valid • novel • potentially useful • and ultimately understandable patterns in data. • from Advances in Knowledge Discovery and Data Mining, Fayyad, Piatetsky-Shapiro, Smyth, and Uthurusamy, (Chapter 1), AAAI/MIT Press 1996 Source: Gregory Piatetsky-Shapiro
Related Fields Machine Learning Visualization Data Mining and Knowledge Discovery Statistics Databases Source: Gregory Piatetsky-Shapiro
__ ____ __ ____ __ ____ Patterns and Rules Knowledge Discovery Process Integration Interpretation & Evaluation Knowledge Data Mining Knowledge RawData Transformation Selection & Cleaning Understanding Transformed Data Target Data DATA Ware house Source: Gregory Piatetsky-Shapiro
OLAP • Online Line Analytical Processing • Intended to provide multidimensional views of the data • I.e., the “Data Cube” • The PivotTables in MS Excel are examples of OLAP tools
Data + Text Mining Process Source: Languistics via Google Images
How Can We Do Data Mining? • By Utilizing the CRISP-DM Methodology • a standard process • existing data • software technologies • situational expertise Source: Laura Squier
Framework for recording experience Allows projects to be replicated Aid to project planning and management “Comfort factor” for new adopters Demonstrates maturity of Data Mining Reduces dependency on “stars” Why Should There be a Standard Process? The data mining process must be reliable and repeatable by people with little data mining background. Source: Laura Squier
Process Standardization • CRISP-DM: • CRossIndustry Standard Process for Data Mining • Initiative launched Sept.1996 • SPSS/ISL, NCR, Daimler-Benz, OHRA • Funding from European commission • Over 200 members of the CRISP-DM SIG worldwide • DM Vendors - SPSS, NCR, IBM, SAS, SGI, Data Distilleries, Syllogic, Magnify, .. • System Suppliers / consultants - Cap Gemini, ICL Retail, Deloitte & Touche, … • End Users - BT, ABB, Lloyds Bank, AirTouch, Experian, ... Source: Laura Squier
CRISP-DM • Non-proprietary • Application/Industry neutral • Tool neutral • Focus on business issues • As well as technical analysis • Framework for guidance • Experience base • Templates for Analysis Source: Laura Squier
The CRISP-DM Process Model Source: Laura Squier
Why CRISP-DM? • The data mining process must be reliable and repeatable by people with little data mining skills • CRISP-DM provides a uniform framework for • guidelines • experience documentation • CRISP-DM is flexible to account for differences • Different business/agency problems • Different data Source: Laura Squier
Phases and Tasks Business Understanding Data Understanding Data Preparation Modeling Deployment Evaluation Determine Business Objectives Background Business Objectives Business Success Criteria Situation Assessment Inventory of Resources Requirements, Assumptions, and Constraints Risks and Contingencies Terminology Costs and Benefits Determine Data Mining Goal Data Mining Goals Data Mining Success Criteria Produce Project Plan Project PlanInitial Asessment of Tools and Techniques Collect Initial Data Initial Data Collection Report Describe Data Data Description Report Explore Data Data Exploration Report Verify Data Quality Data Quality Report Data Set Data Set Description Select Data Rationale for Inclusion / Exclusion Clean Data Data Cleaning Report Construct Data Derived Attributes Generated Records Integrate Data Merged Data Format Data Reformatted Data Select Modeling Technique Modeling Technique Modeling Assumptions Generate Test Design Test Design Build Model Parameter Settings Models Model Description Assess Model Model AssessmentRevised Parameter Settings Evaluate Results Assessment of Data Mining Results w.r.t. Business Success Criteria Approved Models Review Process Review of Process Determine Next Steps List of Possible Actions Decision Plan Deployment Deployment Plan Plan Monitoring and Maintenance Monitoring and Maintenance Plan Produce Final Report Final Report Final Presentation Review Project Experience Documentation Source: Laura Squier
Phases in CRISP • Business Understanding • This initial phase focuses on understanding the project objectives and requirements from a business perspective, and then converting this knowledge into a data mining problem definition, and a preliminary plan designed to achieve the objectives. • Data Understanding • The data understanding phase starts with an initial data collection and proceeds with activities in order to get familiar with the data, to identify data quality problems, to discover first insights into the data, or to detect interesting subsets to form hypotheses for hidden information. • Data Preparation • The data preparation phase covers all activities to construct the final dataset (data that will be fed into the modeling tool(s)) from the initial raw data. Data preparation tasks are likely to be performed multiple times, and not in any prescribed order. Tasks include table, record, and attribute selection as well as transformation and cleaning of data for modeling tools. • Modeling • In this phase, various modeling techniques are selected and applied, and their parameters are calibrated to optimal values. Typically, there are several techniques for the same data mining problem type. Some techniques have specific requirements on the form of data. Therefore, stepping back to the data preparation phase is often needed. • Evaluation • At this stage in the project you have built a model (or models) that appears to have high quality, from a data analysis perspective. Before proceeding to final deployment of the model, it is important to more thoroughly evaluate the model, and review the steps executed to construct the model, to be certain it properly achieves the business objectives. A key objective is to determine if there is some important business issue that has not been sufficiently considered. At the end of this phase, a decision on the use of the data mining results should be reached. • Deployment • Creation of the model is generally not the end of the project. Even if the purpose of the model is to increase knowledge of the data, the knowledge gained will need to be organized and presented in a way that the customer can use it. Depending on the requirements, the deployment phase can be as simple as generating a report or as complex as implementing a repeatable data mining process. In many cases it will be the customer, not the data analyst, who will carry out the deployment steps. However, even if the analyst will not carry out the deployment effort it is important for the customer to understand up front what actions will need to be carried out in order to actually make use of the created models.
Phases in the DM Process: CRISP-DM Source: Laura Squier
Business Understanding: Statement of Business Objective Statement of Data Mining objective Statement of Success Criteria Data Understanding Explore the data and verify the quality Find outliers Phases in the DM Process (1 & 2) Source: Laura Squier
Phases in the DM Process (3) • Data preparation: • Takes usually over 90% of our time • Collection • Assessment • Consolidation and Cleaning • table links, aggregation level, missing values, etc • Data selection • active role in ignoring non-contributory data? • outliers? • Use of samples • visualization tools • Transformations - create new variables Source: Laura Squier
Phases in the DM Process (4) • Model building • Selection of the modeling techniques is based upon the data mining objective • Modeling is an iterative process - different for supervised and unsupervised learning • May model for either description or prediction Source: Laura Squier
Prediction Models for Predicting and Classifying Regression algorithms (predict numeric outcome): neural networks, rule induction, CART (OLS regression, GLM) Classification algorithm predict symbolic outcome): CHAID (CHi-squared Automatic Interaction Detection), C5.0 (discriminant analysis, logistic regression) Descriptive Models for Grouping and Finding Associations Clustering/Grouping algorithms: K-means, Kohonen Association algorithms: apriori, GRI Types of Models Source: Laura Squier
Data Mining Algorithms • Market Basket Analysis • Memory-based reasoning • Cluster detection • Link analysis • Decision trees and rule induction algorithms • Neural Networks • Genetic algorithms
Market Basket Analysis • A type of clustering used to predict purchase patterns. • Identify the products likely to be purchased in conjunction with other products • E.g., the famous (and apocryphal) story that men who buy diapers on Friday nights also buy beer.
Memory-based reasoning • Use known instances of a model to make predictions about unknown instances. • Could be used for sales forecasting or fraud detection by working from known cases to predict new cases
Cluster detection • Finds data records that are similar to each other. • K-nearest neighbors (where K represents the mathematical distance to the nearest similar record) is an example of one clustering algorithm
Kohonen Network • Description • unsupervised • seeks to describe dataset in terms of natural clusters of cases Source: Laura Squier
Link analysis • Follows relationships between records to discover patterns • Link analysis can provide the basis for various affinity marketing programs • Similar to Markov transition analysis methods where probabilities are calculated for each observed transition.
Decision trees and rule induction algorithms • Pulls rules out of a mass of data using classification and regression trees (CART) or Chi-Square automatic interaction detectors (CHAID) • These algorithms produce explicit rules, which make understanding the results simpler
Rule Induction • Description • Produces decision trees: • income < $40K • job > 5 yrs then good risk • job < 5 yrs then bad risk • income > $40K • high debt then bad risk • low debt then good risk • Or Rule Sets: • Rule #1 for good risk: • if income > $40K • if low debt • Rule #2 for good risk: • if income < $40K • if job > 5 years Source: Laura Squier
Rule Induction • Description • Intuitive output • Handles all forms of numeric data, as well as non-numeric (symbolic) data • C5 Algorithm a special case of rule induction • Target variable must be symbolic Source: Laura Squier
Apriori • Description • Seeks association rules in dataset • ‘Market basket’ analysis • Sequence discovery Source: Laura Squier
Neural Networks • Attempt to model neurons in the brain • Learn from a training set and then can be used to detect patterns inherent in that training set • Neural nets are effective when the data is shapeless and lacking any apparent patterns • May be hard to understand results
Neural Network Input layer Hidden layer Output Source: Laura Squier
Neural Networks • Description • Difficult interpretation • Tends to ‘overfit’ the data • Extensive amount of training time • A lot of data preparation • Works with all data types Source: Laura Squier
Genetic algorithms • Imitate natural selection processes to evolve models using • Selection • Crossover • Mutation • Each new generation inherits traits from the previous ones until only the most predictive survive.
Phases in the DM Process (5) • Model Evaluation • Evaluation of model: how well it performed on test data • Methods and criteria depend on model type: • e.g., coincidence matrix with classification models, mean error rate with regression models • Interpretation of model: important or not, easy or hard depends on algorithm Source: Laura Squier
Phases in the DM Process (6) • Deployment • Determine how the results need to be utilized • Who needs to use them? • How often do they need to be used • Deploy Data Mining results by: • Scoring a database • Utilizing results as business rules • interactive scoring on-line Source: Laura Squier
Specific Data Mining Applications: Source: Laura Squier
What data mining has done for... The US Internal Revenue Service needed to improve customer service and... Scheduled its workforce to provide faster, more accurate answers to questions. Source: Laura Squier
What data mining has done for... The US Drug Enforcement Agency needed to be more effective in their drug “busts” and analyzed suspects’ cell phone usage to focus investigations. Source: Laura Squier
What data mining has done for... HSBC need to cross-sell more effectively by identifying profiles that would be interested in higher yielding investments and... Reduced direct mail costs by 30% while garnering 95% of the campaign’s revenue. Source: Laura Squier
Analytic technology can be effective • Combining multiple models and link analysis can reduce false positives • Today there are millions of false positives with manual analysis • Data Mining is just one additional tool to help analysts • Analytic Technology has the potential to reduce the current high rate of false positives Source: Gregory Piatetsky-Shapiro
Data Mining with Privacy • Data Mining looks for patterns, not people! • Technical solutions can limit privacy invasion • Replacing sensitive personal data with anon. ID • Give randomized outputs • Multi-party computation – distributed data • … • Bayardo & Srikant, Technological Solutions for Protecting Privacy, IEEE Computer, Sep 2003 Source: Gregory Piatetsky-Shapiro
The Hype Curve for Data Mining and Knowledge Discovery Over-inflated expectations Growing acceptance and mainstreaming rising expectations Disappointment Source: Gregory Piatetsky-Shapiro
More on OLAP and Data Mining • Nice set of slides with practical examples using SQL (by Jeff Ullman, Stanford – found via Google with no attribution)
OLAP • Online Line Analytical Processing • Intended to provide multidimensional views of the data • I.e., the “Data Cube” • The PivotTables in MS Excel are examples of OLAP tools
Visualization – Star Schema Dimension Table (Bars) Dimension Table (Drinkers) Dimension Attrs. Dependent Attrs. Fact Table - Sales Dimension Table (Beers) Dimension Table (etc.) From anonymous “olap.ppt” found on Google
Typical OLAP Queries • Often, OLAP queries begin with a “star join”: the natural join of the fact table with all or most of the dimension tables. • Example: SELECT * FROM Sales, Bars, Beers, Drinkers WHERE Sales.bar = Bars.bar AND Sales.beer = Beers.beer AND Sales.drinker = Drinkers.drinker; From anonymous “olap.ppt” found on Google
Example: In SQL SELECT bar, beer, SUM(price) FROM Sales NATURAL JOIN Bars NATURAL JOIN Beers WHERE addr = ’Palo Alto’ AND manf = ’Anheuser-Busch’ GROUP BY bar, beer; From anonymous “olap.ppt” found on Google