Download

1 / 16
160 likes | 229 Views
On the Power of Off-line Data in Approximating Internet Distances. Danny Raz ( danny@cs.technion.ac.il ) Technion - Israel Institute of Technology and Prasun Sinha ( prasunsinha@lucent.com ) Bell Labs., Lucent Technologies. Outline. Internet Distance Off line metrics

E N D
On the Power of Off-line Data in Approximating Internet Distances Danny Raz (danny@cs.technion.ac.il) Technion - Israel Institute of Technology and Prasun Sinha (prasunsinha@lucent.com) Bell Labs., Lucent Technologies
Outline • Internet Distance • Off line metrics • Geographic distance, #hops, # AS, depth • Linear Regression for Internet distance estimation • Multi-variable linear regression • Accuracy of picking closest mirror site • The next step
Internet Distance • Internet Distance: one way delay between hosts • Components of Internet Distance • Dynamic • Server Load • Network Congestion / Router Load • Static • propagation delay over the links • Router processing delay • Edge-router processing delay Goal: To study the power of estimating the Static Internet Distance using off-line metrics
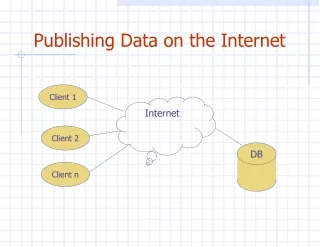
Importance of Internet Distance Estimation • Picking closest mirror-site/cache • For use in Content Distribution Networks
Approaches • Dynamic • Dynamic probing [Dykes et. al. Infocom ’00] • Passive monitoring [Andrews et. al. Infocom ’02] • Static • Semi-active probing (IDMAPs) [Jamin et. al. Infocom ’00] • Other relevant work: • Geographic Distance and RTT: [Padmanabhan Sigcomm ‘02]
Static Internet Distance AS #1 AS #2 AS #3 Core Router Edge Router • Propagation delay: geographical distance • Router processing delay: # hops • Edge-router processing delay: # AS AS: Autonomous System Static Internet Distance = geo-distance + hop-count + AS-count ?
Data Collection • Clients: 2500 public libraries in US • Servers (mirrors/caches): 8 traceroute locations in US • The location (latitude, longitude) is known for every host. • For every client-server pair • Run multiple (10) traceroutes • Pick the traceroute result with the smallest RTT • Compute • Geo-distance: based on latitude and longitude • Hop-count: from traceroute • AS-count: from traceroute based on names of routers and IP Address Prefixes
Linear Regression(Geo-distance and Hop-count) minRTT vs. Hop-count SE (Std. Error) = 25.71 minRTT vs. Geo-distance SE (Std. Error) = 26.93
Multiple Linear Regression (Multiple metrics) minRTT vs. Geo-distance, Hop-count SE = 21.52 minRTT vs. Geo-distance, AS-count SE = 23.80
minRTT = geo-distance + hop-count +AS-count ? • High correlation between hop-count and AS-count (highest among any other pair of metrics) • Hop-count and AS-count should not be used together
A new Off-line metric: Depth • Hop-count: requires dynamic probing • Introduce an alternate metric: Depth • Average Hop-count to the nearest backbone network (a hand-made list of 30 big core networks) • Constant per host (client/server) • Alternately, measure in units of time rather than hops • (Client depth + Server depth) as a metric
Linear Regression (Depth) minRTT vs. Depth SE = 41.02 minRTT vs. Depth and Geo-distance SE = 24.52
Accuracy of picking the nearest mirror site 880 clients and 8 servers
Summary • Combination of hop-count and geographic distance improves over individual metrics • Using Depth along with Geo-distance improves performance and is completely off-line • For closest mirror selection with 30 ms allowed deviation, almost any metric gives 90% accuracy Is there much space to improve?
The Next Step • Global Data • Collection and analysis of data based on clients and servers spread across the globe • Using both off-line and on-line • Techniques to combine the power of off line estimation with on-line estimation.