Download
1 / 65
670 likes | 841 Views
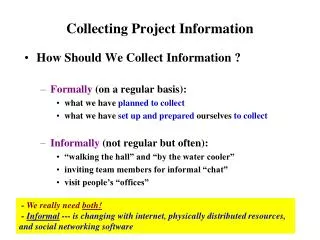
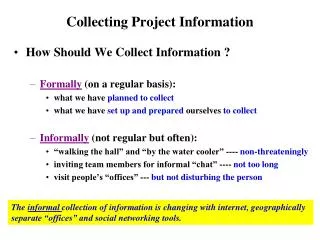
Prof. Dr. Ali ŞEN. Checksheet Collecting and classifying information for analysis. Brainstorm-Checksheet-Pareto-Cause Effect-Benchmark. Prof. Dr. Ali ŞEN. Checksheet Collecting and classifying information for analysis. Brainstorm -Checksheet-Pareto-Cause Effect-Benchmark

E N D
Prof. Dr. Ali ŞEN ChecksheetCollecting and classifying information for analysis Brainstorm-Checksheet-Pareto-Cause Effect-Benchmark
Prof. Dr. Ali ŞEN ChecksheetCollecting and classifying information for analysis Brainstorm-Checksheet-Pareto-Cause Effect-Benchmark Identify Potential Problems
Prof. Dr. Ali ŞEN ChecksheetCollecting and classifying information for analysis Brainstorm-Checksheet-Pareto-Cause Effect-Benchmark Identify Frequency of Occurance
Prof. Dr. Ali ŞEN ChecksheetCollecting and classifying information for analysis Brainstorm-Checksheet-Pareto-Cause Effect-Benchmark Prioritrize Problems
Prof. Dr. Ali ŞEN ChecksheetCollecting and classifying information for analysis Brainstorm-Checksheet-Pareto-Cause Effect-Benchmark Identify Root Causes of the Problems
Prof. Dr. Ali ŞEN ChecksheetCollecting and classifying information for analysis Brainstorm-Checksheet-Pareto-Cause Effect-Benchmark Find & Plan Solutions of the Problems
Prof. Dr. Ali ŞEN ChecksheetCollecting and classifying information for analysis Guide toBrainstorming
Contents • What is brainstorming? • Why use brainstorming techniques? • Brainstorming is not a structured meeting • The process of brainstorming • The environment • Setting the scene • Rules for the session • A brainstorming technique • Affinity analysis • Summary and future action
What is brainstorming? • Brainstorming is a means of generating ideas. • Brainstorming can be used to identify alternatives, obtain a complete list of items and to solve problems. • There are a variety of brainstorming techniques. • The common principle of brainstorming is to set aside the restrictive thinking processes so that many ideas can be generated.
When to use brainstorming? You can use brainstorming in a project when: • Developing the solution definition, particularly in identifying alternative solutions. • Identifying all potential risks on a project. • Developing the Work Breakdown Structure (identifying all the deliverables and work items). • Dealing with difficult problems that arise during the course of the project.
Why use brainstorming techniques? • Brainstorming can: • break through traditional thinking about a problem. • generate new ways of thinking. • provide an environment for building on new ideas. • reduce the tendency to prematurely discard new ideas. • facilitate team building. • encourage team problem solving.
Brainstorming is not a structured meeting • Brainstorming is: • Idea generation • Issue generation • Divergent thinking • Open format • Structured meeting is: • Fixed agenda • Chairperson • Minutes • Action items
The process of brainstorming • The environment • Setting the scene • Rules for the session • Running the brainstorming session • Affinity analysis • Summary and further action
The environment • Location: preferable to be held away from normal place of work • Room: natural light, plenty of space • Materials: whiteboard and pens. Provide a pack of post-it notes and pen for each attendee
Setting the scene… • Explain the brainstorming technique. • Specify the rules. • Loosening up: use a free thinking exercise and/or a practice brainstorming session*.For example: how could safety of taxi drivers be improved? * The facilitator provides exercises and determines when the participants are ready to proceed with the technique.
Rules for the session • Any idea is valid • No judgement or criticism allowed • Mobile phones switched off • Participants cannot leave the room during the brainstorming session
A brainstorming technique • Present the problem or opportunity for which brainstorming is being applied • Allocate 3-5 minutes to write on the post-it notes as many ideas as possible – one idea per note • Each person quickly writes their thoughts onto the post-it notes regardless of how impractical, outrageous, extreme, crazy they may be (do not filter the ideas)
Affinity analysis • Each person in turn sticks their post-it notes on the whiteboard, putting their note near to an idea that is similar to theirs. This should result in clusters of post-it notes representing similar ideas. • Review the ideas by cluster. For each type of idea ask the group “How could we make this work?” Discuss each variation of the idea and refine to develop a possible solution.
Summary and future action • Write up a summary of each type of idea/solution presented. • Determine an action plan for working through the ideas. • The action plan may be to test or further research the alternatives identified to select a shortlist of the most suitable solutions for further evaluation.
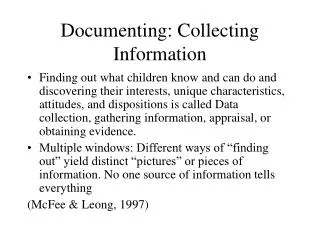
Prof. Dr. Ali ŞEN ChecksheetCollecting and classifying information for analysis
Check Sheet – Content What is it for? • To manually collect data in a reliable, organised way. • To present the facts for further investigation. • For recording and presenting direct observations and facts about a process. Where could I use it? • When observing a process and recording information over time. • When measuring and visualising the effect of a problem on a process. • When checking a solution to see the improvement. How do I use it? • Identify the objective and scope of the data to be collected • Decide on the time period • Design the Check Sheet • Test the Check Sheet • Collect the data • Interpret the results Risks and how to avoid them Example
Check Sheet - What is it for? • Uses of this tool: • A Check Sheet is a tool for manual data gathering, and a logical point to start in process improvement projects. It is particularly useful for gathering facts rather than opinions about the process, thus ensuring that the analysis and solution development is carried out on a factual basis. • A Check Sheet is a simple form organised to simplify and standardise data collection and to make the interpretation of the results easier. • A form of Check Sheet can also be used as a checklist to control the undertaking of a series of events or actions. • Expected Benefits: • Clear identification of exactly what is to be observed, what is to be collected (the facts), when and by whom. • A visual and organised means of manually collecting the data. • Standardisation of data collection, making comparisons easy. • Clear results making interpretation easier.
Check Sheet - Where could I use it? • Background: • Some data collection can be automated, but not always (e.g. counting the number of times delays were caused because a part was unavailable). Check Sheets provide an organised and visible way of manually collecting this data. • Check Sheets are one of the ‘seven basic’ tools described by the Japanese guru Ishikawa. • Uses: • Use it during analysis phase to collect information on the performance of the process. • When data is to be collected manually, use it to ensure that the observations are recorded clearly and can be used easily later on. • Use it when each measurement needs to be checked as it is recorded, for example that it is within a given tolerance. • Use it when it is useful to see the distribution of the measured observations as they are taken. • Use it when the completion of a series of actions needs to be checked.
Check Sheet - How do I use it? Procedure and Guidance Notes: • Select and agree on the exact event to be measured. State the objective - why the data is needed. • Define the scope of the data collection - what will be measured, where it is to be collected, who is to collect and when. Be clear about why the data is needed - this will ensure that the right information is recorded. It is better to collect too much than not enough. Decide if only samples need to be taken. Identify objectives & scope • Decide on the data collection time period. This includes both how often (frequency) and how long (duration). • Estimate the maximum number of measurements that will be needed. For statistical measures this can be 100 or more. Consider also whether the data to be collected is ‘attribute’ (i.e data that can be counted e.g. the number of errors) or ‘variable’ (i.e. measured on a continuous scale e.g. weight). Decide time period • Design a Check Sheet that is simple to use and provides clear information. • Label columns and add space for the date, the person collecting the data and any other useful information. Common designs for Check Sheets are described on the next page. Design the Check Sheet • Ensure that the Check Sheet works as intended by trying it out. • Make any necessary changes. • Ensure that the data collectors are able to use the Check Sheet. Preferably test the Check Sheet in a real situation and by someone who was not involved in the design. Consider training or work instructions. Test Check Sheet • Collect the data and fill in the Check Sheet. • Be honest in recording the information. • Collect representative samples if appropriate. Deciding whether samples are to be taken should be planned in at the outset. Collect data • Interpret the results and use them as planned. Interpret results
Check Sheet - How do I use it? - Common designs A Process Distribution Check Sheet measures the frequency of a single item across a range of measures - produces a histogram. A Checklistcontains a list of actions which are ticked off as they are done.. A Defective Item Check Sheet counts and classifies defects by type. • A Defective Cause Check Sheetaims to correlate cause and effect by including possible causal factors. • A Work Sampling Check Sheetis used to analyse how time is spent, by classifying the type of activity being done at randomly selected moments. • A Travelling Check Sheetmoves with a product throughout production and forms a complete running record of all test and inspections. A Location Plotuses a picture of the item to mark defect positions.
Check Sheet - Risks and how to avoid them • Risks : • Mistakes are made in collecting the data, such as missing defects or identifying data which is not targeted for collection. • Data is interpreted incorrectly. • Localised problems are assumed more widespread than they are. • Steps to avoid them : • Data has been collected in a disorganised way. Design the Check Sheet carefully, test it and train the people who will use it. • Collect supplementary information on the sheets to allow the problems to be broken down - e.g. the circumstances where the measurements were made. • Again - collect supplementary information to describe the conditions. This will be used to identify why problems occur in one location and not others
Check Sheet - Example 1. Identify Objective Discover & remove the main causes of paint blemishes in doors 2. Decide time period Investigate the number of bubble, run or scuff problems by robot and paint batch over a week. 6. Interpret results Discovered that most problems occurred at corners, where the robot was ‘hesitating’. Re-programming corrected this. 3. Design Check Sheets Will use a combination of Defective Item Check Sheet and Location Plot 5. Collect the data Paint bubbles were found to be the most common problem. 4. Test Data Two people separately used the Check Sheet on the same robot and batch and the results were found to be identical
Pareto AnalysisIdentifying the vital few causes of the majority of problems
Pareto Analysis – Content What is it for? • A graphical method of comparing and sorting a set of measures. • Pareto Analysis uses the ’80/20 Rule’ to select the ‘vital few’ items for further action 80/20 Where could I use it? • When selecting problems, causes or solutions to take forward for further action. • When you want to visibly demonstrate priorities. How do I use it? • Identify items to compare • Choose measurement units • Plan the measurement • Measure as planned • Plot the chart • Select the focus • Take action Risks and how to avoid them Example
Pareto Analysis - What is it for? • Uses of this tool: • When you are faced with a set of measurements to compare, Pareto Analysis can be used to prioritise these and highlight those which are most important. • The visual output from Pareto Analysis is useful in situations where you want to communicate your findings and explain its significance to others. • Expected Benefits: • Pareto Analysis helps you focus on the most important actions and thus leads to the best solutions and the optimum return from your efforts and investments.
Pareto Analysis - Where could I use it? • Background: • Pareto Analysis is named after the 19th Century Italian Economist, Vilfredo Pareto, who noticed that approximately 80% of the wealth of the country was owned by 20% of the people. He also noted that this pattern repeated itself : of the 20% rich people, 80% of the wealth that they held was owned by 20% of these people. • In the 20th Century, Joseph Juran noticed that this rule can be applied to business situations to help focus action on ‘the vital few’ items. • This underlying principle is also known as ‘The 80/20 Rule’. • Uses: • The most common use of the tool is during problem analysis to find those sub-problems which, when addressed, will return the greatest benefits. • Pareto Analysis can also be used in any general situation where you want to prioritise action. For example, you could use it when selecting potential solutions, by comparing their cost-benefit ratios. • You can also use it in a team situation to show results of voting.
Pareto Analysis - How do I use it? Procedure and Guidance Notes • Identify the items to be analysed and charted. • These should be a single complete group that can be measured in the same way. For example ‘Damaged seats’ Identify Itemsto compare • Find a measurement unit this that will lead to the highest bar being the most important to address. • This is often a count of something. A weighting factor may be used to ensure the highest number is the most important. For example, Number of defects multiplied by cost of repair. Choose measurement units • Determine how many items must be measured to build a representative chart. • Plan the detail of the work, including who will measure what, how, for how long, and so on. If possible aim for around 50 items, as this will give a statistically repeatable chart. If you repeat the measurement, keep all conditions as similar as possible. Plan the measurement • Carry out the measurement as planned. • A Check Sheet can be used to manually record measurements. Measure as planned • Plot the results in vertical bars, sorted with the highest bar on the left. If there are a lot of items that would lead to a long tail of small bars, you can combine these into an ‘others’ bar (which still should be positioned on the right of the chart). Plot the chart • Choose the number of bars which you will address further (this is usually one or two). If all bars are of a similar height, it is difficult to find the right focus. In this case it can worth repeating the exercise using different measurement units. Select the focus • Take the work to the next stage by acting on your findings. If the bar selected is big, you can find a further focus by breaking this down into a sub-Pareto chart. Take action
Pareto Analysis - Risks and how to avoid them • Risks : • Selecting the wrong items, such as jumping to conclusions rather than using proven facts. • Using measures which lead to the highest bar on the chart indicating something that is not the most appropriate item to address. • Assuming the people who are doing the measurement are motivated and able to do this. • Ending up with things that are too-big to address. • Last-minute changes that are based on intuition rather than measurements and known facts. • Steps to avoid them : • Take care to start with the right problem. • Remember that the focus is to find the most important item, so get measurements right. • Educate the people who are doing the measurements and check with their managers that they can do this extra work. • Carefully consider the effort you will need to address the selected items. If this will be too much, then take another step to find a lower-level focus. • Be very careful when taking intuitive leaps. It is often better to trust a process which can later be verified.
Pareto Analysis - Example 1. Identify Items Item to measure: Core cutting defects 2. Choose measurement units • Measurement alternatives: • Type of defect • Location of defect • Customer impact of defect • Hours lost due to defect 3. Plan the measurement 5. Plot the chart 4. Measure as planned 6. Select the focus 7. Take action
Cause and Effect Diagram(C&E, Ishikawa, Fault or Fishbone Diagram)
Prof. Dr. Ali ŞEN ChecksheetCollecting and classifying information for analysis • Cause and Effect Diagram
Objective In This Module We Will…. • Define a Cause and Effect diagram • Understand the elements of C&E analysis • Understand why and when to use C&E diagrams • Understand the importance of team involvement when brainstorming • Workshop on project team’s C&E Diagram
Main Category Problem/ Desired Improvement Cause Root Cause Cause & Effect Diagram • The Cause and effect diagram is also called: • Fishbone Diagram-because of the way it looks • Ishakawa Diagram for the inventor, Dr. Kaoru Ishakawa.
Main Category Problem/ Desired Improvement Cause Root Cause What is a Cause and Effect Diagram? • A visual tool to identify, explore and graphically display, in increasing detail, all of the suspected possible causes related to a problem or condition to discover its root causes. • Not a quantitative tool
Why Use Cause & Effect Diagrams? • Focuses team on the content of the problem • Creates a snapshot of the collective knowledge of team • Creates consensus of the causes of a problem • Builds support for resulting solutions • Focuses the team on causes not symptoms • To discover the most probable causes for further analysis • To visualize possible relationships between causes for any problem current or future • To pinpoint conditions causing customer complaints, process errors or non-conforming products • To provide focus for discussion
Product/Manufacturing Man Methods Machine Five Key Sources of Variation + Environment Measurement Materials Use cause and effect diagram to single out variation sources within the “5M’s + E”
Transactional/Service People Procedures Policies Five Key Sources of Variation Environment + Measurement Place Use cause and effect diagram to single out variation sources within the “4P’s + M&E”
Main Category Problem Cause Sub-Cause Root Cause Fishbone - Cause and Effect Diagram Causes Effect Shows various influences on a process to identify most likely root causes of problem
Constructing a C&E Diagram Materials Methods Problem/ Maintenance Machinery Manpower Brainstorm to determine root causes and add those as small branches off major bones
Fishbone Diagram Example Fishbone diagram sourced from GOAL/QPC Black Belt Memory Jogger published 2002
Physical C&E Construction • C&E Fishbone diagrams can be constructed two ways: • Paper and pen • Usually more effective when working in a team • May take multiple sheets of flip chart paper • Many teams find it helpful to do the flip chart method first because it lends itself to group dynamics. Everyone can see and participate easier. • Minitab software • Very helpful when sharing diagram with an audience outside of your team
C&EWorkshop In Project Teams, complete the following items: 1. Determine the problem or “head’ of the fishbone 2. Determine if your process is Transactional/Commercial or Product/Industrial 3. Create a Cause & Effect (C&E) Fishbone diagram using: - 4 P’s and M & E (Transactional process)* - 5 M’s and E (Product process)* * Use the headings (Ps and Ms) as guidelines. Customize to better describe the process
Prof. Dr. Ali ŞEN ChecksheetCollecting and classifying information for analysis • Introduction to Benchmarking Improving Performance Basedon External Assessment
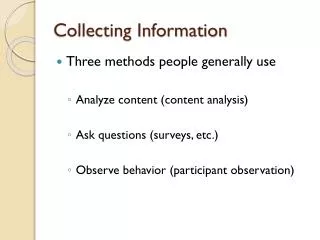
Agenda • What is benchmarking? • Why do people do it? • Why should we do it? • How is it done? • What do you do with the data or information you get? • What’s “benchmarking protocol”? • Is there any ongoing commitment to partners?