Download
1 / 25
250 likes | 365 Views
Interactives of Olympic Proportions The Diffusion of Data Journalism at The New York Times. Cindy Royal, Ph.D. School of Journalism and Mass Communication Texas State University cindyroyal.com Find this presentation at slideshare.net/cindyroyal. Introduction.

E N D
Interactives of Olympic ProportionsThe Diffusion of Data Journalism at The New York Times Cindy Royal, Ph.D. School of Journalism and Mass Communication Texas State University cindyroyal.com Find this presentation at slideshare.net/cindyroyal
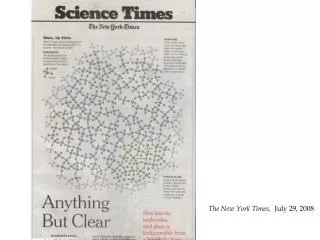
Introduction • Programming and data techniques are rapidly influencing the ways organizations tell stories • Few organizations currently have the resources to deliver comprehensive, online, data-driven, interactive news presentations, but many are seeking to gain these competencies. • The Olympic Games provide engaging content and visuals, potential for multimedia, and a plethora of data for presentation and interaction. • Starting with the 2008 Beijing Summer Olympics, the influence of Interactive News team on the graphic work of the organization can be observed.
Overview • This study analyzes the evolution of graphic and data visualization at The New York Times through the lens of Olympic coverage since 2008. • By comparing the graphic coverage of NYT for the 2008, 2010, 2012 Olympics, this provides a good barometer for the types of graphic work being done and the diffusion of innovation influencing the field of journalism.
Literature • “Excellence in statistical graphics consists ofcomplex ideas communicated with clarity, precision and efficiency” - Tufte • “Knowing what to do with data is the essence of the new precision journalism” - Meyer • Programmer/Journalist - Holovaty • Very few articles in mass communication on data journalism • The Journalist as Programmer • Data-driven journalism and the public good: “Computer-assisted-reporters” and “programmer-journalists” in Chicago - Parasie & Dagiral • Interactivity research – McMillan/Downes, Rafaeli, Sundar, Kiousis • Diffusion - “The process by which an innovation is communicated through certain channels over time among the members of a social system.” - Rogers
Research Questions • RQ1: How has the presentation of online graphics on The New York Times website changed since the 2008 Olympics? • H1: Over time, The New York Times will present more Olympic graphics that are interactive. • H2: Over time, The New York Times will present more Olympic graphics that display data.
Method • The main visual Olympic stories done by NYT since 2008 have been conveniently captured and archived on topic pages. • Each interactive was coded for interactivity and presence of data
2008 Beijing Olympics Interactives www.nytimes.com/ref/sports/olympics/2008_OLYMPICS_INTERACTIVES.html
Vancouver: 2010 Olympics Multimedia - http://www.nytimes.com/interactive/2010/02/22/sports/olympics/olympics-interactives-index.html
London 2012: Oympics Graphics - http://www.nytimes.com/interactive/2012/08/06/sports/olympics/olympic-graphics-collection.html
Interactivity Assessed on a scale of 1-4 1 – limited interactivity for the user; pushing a play button; no ability for non-linear navigation 2 – some interactivity and ability for non-linear navigation, i.e. stepping through a slideshow to select any slide from within any slide. 3- more advanced interactivity; ability to interact with more than one event or section 4 – very advanced interactivity; non-linear navigation; ability to interact with multiple events or sections.
Data • Data, for the purpose of this study, is defined as numeric results, times, scores, medal counts, etc. • Assessed as follows: • None • Embedded - the presentation of a limited amount data within a slideshow or animation, but does not offer any or much interactivity with the data. • Data - the presentation of large amount of data, with the ability to interact with the data or with different sections of the presentation.
2008 Beijing • Presentations with animations and limited data • Photo slideshows or simple audio supplement
2010 Vancouver • Animations to explain and demonstrate techniques
Advanced Data Presentation www.nytimes.com/interactive/2010/02/26/sports/olympics/20100226-olysymphony.html
User Contribution • 2010 Snowboard Halfpipe Library – allowed users to submit their own tricks via video. • 2010 Picturing the Olympics – allowed users to contribute their own photos from the Vancouver games.
2012 London • Interactivity, data and integration with multimedia and animation • Abandoning Flash • In 2012, almost half the projects met the criteria for level 3 or 4 of interactivity (compared with 23% in 2008 and 27% in 2010).
Conclusion • Over time, The New York Times introduced graphic presentations that were more interactive and relied more on data • Understanding how data-driven interactives contribute to storytelling challenge many aspects of mass communication research • content analysis • application of theory • ways in which data is applied in a meaningful setting • Unclear how revenue is to be generated • Interactive presentations have the potential to attract users with data that is unique and customizable. • Interactivity may aid in learning and provide an entertaining use of media • Metrics that identify time and engagement may influence future ad rates
Potential in academic programs • Few programs have the ability to teach these skills • Vast opportunity in providing these skills to journalism students and other communicators • Potential to reach more females to develop tech and data skills. • News delivery via digital methods is the future, and all participants must become familiar with, if not skilled at, concepts that include programming and data.
Thank You! Find this presentation at slideshare.net/cindyroyal