Download
1 / 17
170 likes | 289 Views
16 th ICABR Conference - 128 th EAAE Seminar “The Political Economy of the Bioeconomy : Biotechnology and Biofuel ” Ravello - June 24-27, 2012. Farming Systems Study, with the New LSMS Data – Preliminary Results from Uganda .

E N D
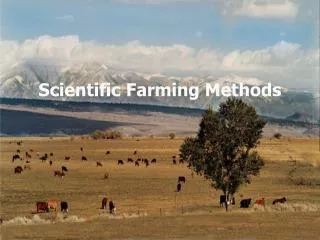
16th ICABR Conference - 128th EAAE Seminar “The Political Economy of the Bioeconomy: Biotechnology and Biofuel” Ravello- June 24-27, 2012 Farming Systems Study, with the New LSMS Data – Preliminary Results from Uganda Hans P Binswanger-Mkhize(1), CalogeroCarletto(2), Sara Savastano(2), Alberto Zezza(2) China Agricultural University, Beijing(2) World Bank (3) CEIS – University of Rome Tor Vergata
Objectives • Use the LSMS data for 6-8 African countries to characterize their current agricultural systems across their climatic zones • To apply the Boserup-Ruthenberg framework of the intensification of farming systems and agricultural technology use • To look at the determinants of agricultural production, private investment and growth • agroclimate • population density • public investment into infrastructure, irrigation, and services • output prices, fertilizer prices and wages • access to banks
The Boserup-Ruthenberg Framework • Higher population density and market access • Reduce the proportion of land agricultural held under fallow • Leads to the transition from the hand how to the plough via animal draft or tractors • Leads to the introduction of organic fertilizers and manures • Drives investment in drainage and other land improvements, and in irrigation • Increases labor use required to produce annual food supply • Leads to higher outputs per ha • Encourages adoption of yield increasing technologies
The LSMS-ISA data sets • 6 countries, to have panel data sets of around 3000 households, managed by World Bank. • Ethiopia, Uganda, Tanzania, Nigeria, Niger, and Malawi • Ghana supported by EGC, Yale, and Burkina by USAID • Witch consumption, all incomes, health, education and agricultural data. • Collection of production, cost, land rights, technology, and land quality at individual plot level. • Extensive collection of community data on infrastructure, services, organizations. • Tanzania, Uganda, Ethiopia, Malawi first round are available. • Uganda has a baseline in 2004/05.
Econometric issues • Populations move to areas of higher agricultural potential and other location advantages • Governments will put more investments in infrastructure, irrigation, and agricultural services in such areas • Therefore we cannot take either population density or public investments as exogenous to the agroclimate • And we cannot analyze the impacts of the determinants of farming systems in the cross section • And even less the output supply, input and investment decisions of farmers
Agroclimate, Population density, and rural infrastructure in India, 1974
With Cross section data • We can do a descriptive analysis across the different agroclimate zones and sub-zones covered in the studies • We can estimate the correlations between the different variables characterizing the farming system • R-value: Proportion of agricultural land under fallow • Average length of fallow • Cropping intensity and irrigation intensity • Adoption of organic manure and fertilizers, mechanization and high yielding varieties • Crop yields in value terms • Estimate the causal impact of agro-climate and geographic location on value of farming systems characteristics and value of crop output
With Panel data Estimate the causal impact of population density and market access on farming systems characteristics and value of output Add other variables whose impact on agricultural output, investment, adoption etc. we would like to know: • Prices and wages • Other infrastructure variables • Agricultural services • Access to banking
Analytical Framework for cross section • I = household, j = Enumeration Area, k = kth dependent variable. (1) • Where D stands for any of the dependent variables • = the agroclimatic potential: maximum monetary yield per ha at international prices and the current cropping patterns of farmers. • The Dependent variables Dk are • = Agroclimatie population density: persons per 1000 dollars of agroclimatic potential. • I = Road density or a vector of infrastructure variables • T = High yielding varieties, or a vector of technologies in use • R = Irrigation • Q = Aggregte crop output per ha • = Farm profits
Data and Descriptive Statistics • We use household and community level data from the ALMS Uganda 2009-2010 • We transform HH/Community level data into Enumeration area data (203 Eas) • We complement our dataset with GIS data on Agro Ecological Zone, NDVI, • And population density at district level from the Uganda National Livestock Census 2008
Agro-Ecological Zones Source: HarvestChoice