Download
1 / 56
560 likes | 715 Views
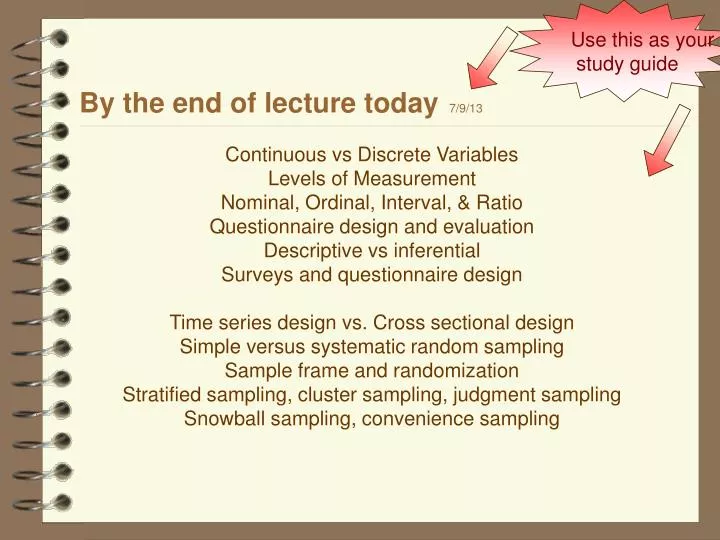
Use this as your study guide. By the end of lecture today 7/9/13. Continuous vs Discrete Variables Levels of Measurement Nominal, Ordinal, Interval, & Ratio Questionnaire design and evaluation Descriptive vs inferential Surveys and questionnaire design

E N D
Use this as your study guide By the end of lecture today7/9/13 Continuous vs Discrete Variables Levels of Measurement Nominal, Ordinal, Interval, & Ratio Questionnaire design and evaluation Descriptive vsinferential Surveys and questionnaire design Time series design vs. Cross sectional design Simple versus systematic random sampling Sample frame and randomization Stratified sampling, cluster sampling, judgment sampling Snowball sampling, convenience sampling
Daily group portfolios • Beginning of each lecture (first 5 minutes) • Meet in groups of 3 or 4 • Quiz one another on class material • Discuss the questions and determine the correct answer for each question • Five copies (one for each group member – and typed) 3 multiple choice questions based on lecture • Include 4 options (a, b, c, and d) • Include a name and describe a person in a certain situation Margaret was interested in taking a Statistics course. It is likely she was interested in studying which of the following?a. economic theories of communism b. theological perspectives of life after death c. musical compositions of the 12th century d. statistical techniques and inference They can be funny or serious, and must be clear and have only one correct answer.
. Please start your Daily Portfolio
Announcements • What to call me? • Dr. Delaney • Suzanne • Any combination of the above • When e.mailing be sure to include all previous • messages 2
Introduction to Statistics for the Social SciencesSBS200, COMM200, GEOG200, PA200, POL200, or SOC200Lecture Section 001, Summer Session II, 20139:00 - 11:20am Monday - FridayRoom 312 Social Sciences (Monday – Thursdays)Room 480 Marshall Building (Fridays) Welcome http://www.youtube.com/watch?v=oSQJP40PcGI
Homework due – Wednesday On class website: please print and complete homework worksheet #2 Please double check – Allcell phones other electronic devices are turned off and stowed away
Schedule of readings Before Friday: Please read chapters 1 - 2 in Ha & Ha textbook Please read Appendix D, E & F online Please read Chapters 1, 5, 6 and 13 in Plous Chapter 1: Selective Perception Chapter 5: Plasticity Chapter 6: Effects of Question Wording and Framing Chapter 13: Anchoring and Adjustment
Please click in My last name starts with a letter somewhere between A. A – D B. E – L C. M – R D. S – Z
In nearly every class we will use clickers to: • answer questions in class and participate in • interactive class demonstrations • We’ll register them on our webpage- then use ‘em! student.turningtechnologies.com (Please note there is no “www”) Ready to go
First test group with placebo drink (sugar pill) If you want to know if “Ginseng drink” is associated with feelings of satisfaction What is the independent variable? What is the dependent variable? How many levels are there of the IV? “Between” or “within” participant design? Placebo Then test same group with “Ginseng drink”
Placebo (single blind) versus double blind procedure • Single blind procedure (example: use of placebo) • Double blind procedure What about experimenter bias?
So far, Measurement: observable actions Theoretical constructs: concepts (like “humor” or “satisfaction”) Operational definitions Validity and reliability Independent and dependent variable Random assignment and Random sampling Within-participant and between-participant design To decide between True vs Quasi Single blind (placebo) and double blind procedures
Duration Continuous versus discrete Continuous variable: Variables that can assume any value. There are (in principle) an infinite number of values between any two numbers Discrete variable: Variables that can only assume whole numbers. There are no intermediate values between the whole numbers Distance Number of kids Height Number of eggs in a carton Number of textbooks required for class
Categorical versus Numerical data Categorical data (also called qualitative data) - a set of observations where any single observation is a word or a number that represents a class or category Numerical data (also called quantitative data) - a set of observations where any single observation is a number that represents an amount or count
Categorical data (also called qualitative data) - a set of observations where any single observation is a word or a number that represents a class or category Numerical data (also called quantitative data) - a set of observations where any single observation is a number that represents an amount or count Handedness - right handed or left handed Family size Hair color Ethnic group GPA Age Yearly salary Breed of dog Gender - male or female Temperature Please note this is a binary variable
Categorical data (also called qualitative data) - a set of observations where any single observation is a word or a number that represents a class or category Numerical data (also called quantitative data) - a set of observations where any single observation is a number that represents an amount or count On a the top half of a writing assignment form please generate two examples of categorical data and two examples of numerical data Please note we’ll use the bottom half for something else
What are the four “levels of measurement”? Categorical data • Nominal data - classification, differences in kind, names of categories • Ordinal data - order, rankings, differences in degree Numerical data • Interval data - measurable differences in amount, equal intervals • Ratio data - measurable differences in amount with a “true zero”
What are the four “levels of measurement”? Categorical data • Nominal data - classification, differences in kind, names of categories • Ordinal data - order, rankings, differences in degree Numerical data • Interval data - measurable differences in amount, equal intervals • Ratio data - measurable differences in amount with a “true zero” Gender - male or female Family size Jersey number Place in a foot race (1st, 2nd, 3rd, etc) Handedness - right handed or left handed
What are the four “levels of measurement”? Categorical data • Nominal data - classification, differences in kind, names of categories • Ordinal data - order, rankings, differences in degree Numerical data • Interval data - measurable differences in amount, equal intervals • Ratio data - measurable differences in amount with a “true zero” Age Hair color Telephone number Ethnic group Breed of dog Temperature Yearly salary
What are the four “levels of measurement”? Categorical data • Nominal data - classification, differences in kind, names of categories • Ordinal data - order, rankings, differences in degree Numerical data • Interval data - measurable differences in amount, equal intervals • Ratio data - measurable differences in amount with a “true zero” Look at your examples of qualitative and quantitative data. Which levels of measurement are they?
Time series versus cross-sectional comparisons: Trends over time versus a snapshot comparison Time series design: Each observation represents a measurement at some point in time. Repeated measurements allow us to see trends. Cross-sectional design: Each observation represents a measurement at some point in time. Comparing across groups allows us to see differences. Traffic accidents Please note: Any one piece of data can often (not always) be used in either a time series comparison or a cross-sectional comparison. It depends how you set up your question. Does Tucson or Albuquerque have more traffic accidents (they have similar population sizes)? Does Tucson have more traffic accidents as the year ends and winter approaches?
Time series versus cross-sectional comparisons: Trends over time versus a snapshot comparison Time series design: Each observation represents a measurement at some point in time. Repeated measurements allow us to see trends. Cross-sectional design: Each observation represents a measurement at some point in time. Comparing across groups allows us to see differences. Unemployment rate Is there an increase in workers calling in sick as the summer months approach? Do more young workers call in sick than older workers? Grade point average (GPA) Does GPA tend to go up or down as students move from freshman to sophomores to juniors to seniors? Does GPA tend to go up or down when you compare Mr. Chen’s class with Mr. Frank’s Freshman English classes?
Descriptive vs inferential statistics Descriptive statistics - organizing and summarizing data Inferential statistics - generalizing beyond actual observations making “inferences” based on data collected
Descriptive or inferential? Descriptive statistics - organizing and summarizing data Inferential statistics - generalizing beyond actual observations making “inferences” based on data collected What is the average height of the basketball team? Measured all of the players and reported the average height Measured only a sample of the players and reported the average height for team In this class, percentage of students who support the death penalty? Measured all of the students in class and reported percentage who said “yes” Measured only a sample of the students in class and reported percentage who said “yes” Based on the data collected from the students in this class we can conclude that 60% of the students at this university support the death penalty Measured all of the students in class and reported percentage who said “yes”
Descriptive or inferential? Descriptive statistics - organizing and summarizing data Inferential statistics - generalizing beyond actual observations making “inferences” based on data collected Men are in general taller than women Measured all of the citizens of Arizona and reported heights Shoe size is not a good predictor of intelligence Measured all of the shoe sizes and IQ of students of 20 universities Blondes have more fun Asked 500 actresses to complete a happiness survey The average age of students at the U of A is 21 Asked all students in the fraternities and sororities their age
Descriptive vs inferential statistics Descriptive statistics - organizing and summarizing data Inferential statistics - generalizing beyond actual observations making “inferences” based on data collected To determine this we have to consider the methodologies used in collecting the data
Sample versus census How is a census different from a sample? Census measures each person in the specific population Sample measures a subset of the population and infers about the population – representative sample is good What’s better? Use of existing survey data U.S. Census Family size, fertility, occupation The General Social Survey Surveys sample of US citizens over 1,000 items Same questions asked each year
Population (census) versus sampleParameter versus statistic Parameter – Measurement or characteristic of the population Usually unknown (only estimated) Usually represented by Greek letters (µ) pronounced “mu” pronounced “mew” Statistic – Numerical value calculated from a sample Usually represented by Roman letters (x) pronounced “x bar”
Simple random sampling: each person from the population has an equal probability of being included Different from random assignment Sample frame = how you define population Let’s take a sample …a random sample Question: Average weight of U of A football player Sample frame population of the U of A football team Pick 24th name on the list Random number table – List of random numbers Or, you can use excel to provide number for random sample =RANDBETWEEN(1,110) Pick 64th name on the list(64 is just an example here) 64
Systematic random sampling: A probability sampling technique that involves selecting every kth person from a sampling frame You pick the number Other examples of systematic random sampling 1) check every 2000th light bulb 2) survey every 10th voter
Stratified sampling: sampling technique that involves dividing a sample into subgroups (or strata) and then selecting samples from each of these groups - sampling technique can maintain ratios for the different groups Average number of speeding tickets 12% of sample is from California 7% of sample is from Texas 6% of sample is from Florida 6% from New York 4% from Illinois 4% from Ohio 4% from Pennsylvania 3% from Michigan etc Average cost for text books for a semester 17.7% of sample are Pre-business majors 4.6% of sample are Psychology majors 2.8% of sample are Biology majors 2.4% of sample are Architecture majors etc
Cluster sampling: sampling technique divides a population sample into subgroups (or clusters) by region or physical space. Can either measure everyone or select samples for each cluster Textbook prices Southwest schools Midwest schools Northwest schools etc Average student income, survey by Old main area Near McClelland Around Main Gate etc Patient satisfaction for hospital 7th floor (near maternity ward) 5th floor (near physical rehab) 2nd floor (near trauma center) etc
Convenience sampling: sampling technique that involves sampling people nearby. A non-random sample and vulnerable to bias Snowball sampling: a non-random technique in which one or more members of a population are located and used to lead the researcher to other members of the population Used when we don’t have any other way of finding them Also vulnerable to biases
Judgment sampling: sampling technique that involves sampling people who an expert says would be useful. A non-random sample and vulnerable to bias Focus group: members can be randomly or not randomly selected. Mediator gathers opinion and information from group. Information can be qualitative or quantitative
Naturalistic Research Naturalistic research: Descriptive method in which observations are made in a natural social setting. Also called field observation. • Survey is a series of self-report measures administered • either through an interview or a written questionnaire • Behavioral data is a measurement of observable actions in natural setting
Interviews Interview often a survey is read to a participant either over the phone or in person Which is better: on phone or in person? Pros: Cons: Unstructured interview Structured interview Which is better: structured or unstructured? Pros: Cons: Focus group
Questionnaires use self-report items for measuring constructs. Constructs are operationally defined by content of items. Wording “Would you say our president is a great president or the greatest president?” The Colbert Report How might we word a question about the Iraq war if we wanted it to reflect support / not? How might we word a question about the gay marriage if we wanted it to reflect support / not? Order How satisfied are you with your relationships with your family? How satisfied are you with your relationship with your romantic partner? spouse?
5 Principles of questionnaire construction 1. Make sure items match research objectives & Identify what constructs you are trying to understand (Be explicit in identifying your constructs) • 2. Responders have the answers to our questions • We are tapping into their attitudes/beliefs/ knowledge • Understand your research participants • “think like” the responders / consider their sensibilities • use appropriate, natural and familiar language (for them) 3. Use appropriate, natural and familiar language
5 Principles of questionnaire construction • 3. Assessment should feel easy and clear, unthreatening • Be clear, precise and concise (short questions) • Minimize use of contingency questions • Start with most friendly (least threatening) questions first • then at the end “now a couple questions about you” (foot in the door phenomenon) • Avoid double negatives • For example: • Agree or disagree? • Teachers shouldn’t have less contact with parents • 4. Avoid ambiguity and bias in your items • Avoid “double-barreled” questions - Difficult to interpret answers • Avoid leading or loaded questions - Can introduce bias • Consider problem of acquiescence – Ask question in different ways • (careful with coding)
5 Principles of questionnaire construction 5. Consider lots of different formats for responses • Consider open-ended vsclosed-ended questions - pros and cons of each - can often modify a question into a closed question • Consider complementing your questionnaire with other forms of data collection (focus group or direct observation) • Pilot – feedback – fix - pilot – analyze – fix - pilot – etc Respect process of empirical approach
Likert Rating scales: measure that allows for rating the level of agreement with a statement. The score reflects the sum of responses on a series of items. Rating scales: a continuum of response choices Anchored rating scales: a written description somewhere on the scale I prefer rap music to classical music Agree 1---2---3---4---5 Disagree Fully anchored rating scales: a written description for each point on the scale I prefer rap music to classical music 1---------2---------3---------4---------5 StronglyDisagree StronglyAgree Agree Disagree Neutral
Summated scales - miniquiz (like Cosmo - ask several questions then sum responses) - For example, several questions on political views (coded so that larger numbers mean “more liberal”) 1. The rights of the community are more important than rights of any one individual agree 1 --- 2 --- 3 --- 4 --- 5 disagree 2. Marriage should be between one man and one woman agree 1 --- 2 --- 3 --- 4 --- 5 disagree 3. Evolution has no place in public education agree 1 --- 2 --- 3 --- 4 --- 5 disagree