Download
1 / 17
170 likes | 262 Views
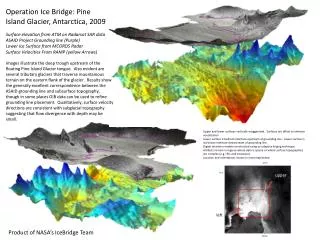
Assessment of OIB 2009 Data over Pine Island and Thwaites Glaciers. K. Jezek OIB Science Team Meeting. MCORDS (Left) and ATM (Right) 2009 data distribution after post processing. Surface Topography. Surface topography from post-processed ATM data and a locally adaptive kriging technique.

E N D
Assessment of OIB 2009 Data over Pine Island and Thwaites Glaciers K. Jezek OIB Science Team Meeting
MCORDS (Left) and ATM (Right) 2009 data distribution after post processing
Surface Topography Surface topography from post-processed ATM data and a locally adaptive kriging technique
Ice Thickness Ice thickness from post-processed MCORDS data and a locally adaptive kriging technique
OIB and AGASEA Surfaces OIB data better capture ice bottom topography details than sparser AGASEA data. OIB ice bottom data consistent with surface topography and mini-MAMM flow field. ASAID grounding line shown for refernce
OIB and AGASEA Surfaces More comparable Thwaites Glacier coverage results in better comparison between OIB and AGASEA derived ice bottom topographies.
SemiVariograms for Floating and Grounded Ice Semivariograms for the ice shelf (red/black) show high spatial correation over lags of 6-10 km. Variance for grounded ice (blue/green) increases rapidly after about 4 km. This indicates that data line spacings should be on the order of 4 km or less.
Along Flow Interface Profiles • Flow lines from miniMamm velocities • ASAID grounding line from Bindschadler (Black) • InSAR grounding line from Rignot et al (white)
Water Layer (red) / Ice (blue) Thickness Water layer thickness generally consistent with ASAID grounding line except in north west where InSAR grounding line better matches
Interface Topographies (Ellipsoidal Heights) If ice thickness bulge at 35 km is accurate and transient, and bathymetry rise at 45 km is accurate, the glacier will reground shortly. Driving stress suggests grounding line fall close to 40 km. ASAID (blue dash) and InSAR (red and green dash) grounding lines appear to be located upstream of topographic high Bathymetry and ice thickness consistent with ASAID and InSAR grounding lines. Surface slope seems anomalously low. Average geoid referenced of ice shelf surface is about 55 m.
Driving Stress Slopes from ellipsoid heights – negligible geoid correction. ASAID and InSAR grounding line consistent in East but may be too far upstream in west . Driving stresses upstream of grounding line comparable to WAIS (10 kPa). Low compared to Jacobshavn (~275 kPa). Geoid Undulaion ζ = h − HN
Antarctic Data Assessment • 5 km grid spacing captures important details per semivariograms and per comparison of surface flow and topographies • Surface topography and ice thickness consistent with previous independent campaigns • Interface topographies from laser altimeter, radar, and gravimeter are generally consistent but anomalies were found near estimated grounding lines. • Internal layers difficult to detect in radar data
Course Corrections • How frequently do we need to vet the bathymetry data given that geologic ‘noise’ will vary between locations • Can we improve internal layer display and mapping ? • There is not an obvious need for additional instruments (P to L band radiometer for 10 m temperature?). Adding instruments (eg ASIRAS) should be done in terms of a science plan. • Review the science requirements in view of platform availability – increase number of regions? • Review ice sheet products list (e.g. surface elevation with a common datum; point and grid data; dh/dt grids; ice thickness; bathymetry; surface velocity; accumulation rate). • Encourage instrument team to put data on their OPEN web sites as soon as data are also available for transfer to NSIDC.
OIB Observations of Pine Island Glacier (From Jezek and Dhanasekaran. Dhanasekaran M.S Thesis, 2011, The Ohio State University)
Pine Island Water Layer Thickness and Grounding line Water layer thickness generally consistent with ASAID/InSAR grounding lines except in northwest where InSAR grounding line better matches. Driving stress and topography suggest that the southerly grounding line is downstream of the estimates. However if accurate, then ice thickness suggests a regrounding of the ice shelf in the near future.