Download

1 / 38
380 likes | 389 Views
An Internally Replicated Quasi-Experimental Comparison of Checklist and Perspective-Based Reading of Code Documents. Laitenberger, etal IEEE TOSE May 2001. Exp Design Guidelines - TTYP. D1: Identify the population from which the subjects and objects are drawn.

E N D
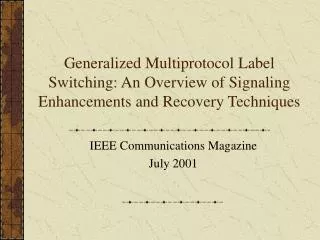
An Internally Replicated Quasi-Experimental Comparison of Checklist and Perspective-Based Reading of Code Documents Laitenberger, etal IEEE TOSE May 2001
Exp Design Guidelines - TTYP D1: Identify the population from which the subjects and objects are drawn. D2: Define the process by which the subjects and objects were selected. D3: Define the process by which subjects and objects are assigned to treatments.
Conduct and collect – DC5 and 6? DC5: For observational studies and experiments, record data about subjects who drop out from the studies. DC6: For observational studies and experiments, record data about other performance measures that may be affected by the treatment, even if they are not the main focus of the study.
Analysis A1: Specify any procedures used to control for multiple testing. A2: Consider using blind analysis. A3: Perform sensitivity analysis.
Analysis A4: Ensure that the data do not violate the assumptions of the tests used on them. A5: Apply appropriate quality control procedures to verify your results. A3: Perform sensitivity analyses.
Presentation P1: Describe or cite a reference for all statistical procedures used. P2: Report the statistical package used. P3: Present quantitative results as well as significance levels. Quantitative results should show the magnitude of effects and the confidence limits.
Presentation P4: Present the raw data whenever possible. Otherwise, confirm that they are available for confidential review by the reviewers and independent auditors. P5: Provide appropriate descriptive statistics. P6: Make appropriate use of graphics.
Interpretation I1: Define the population to which inferential statistics and predictive models apply. I2: Differentiate between statistical significance and practical importance. I3: Define the type of study. I4: Specify any limitations of the study.
An Experiment Measuring the Effects of Personal Software Process (PSP) Training Prechelt and Unger IEEE TOSE May 00
What did you learn?Two Issues • PSP • Experimentation
PSP success These data show, for instance, that the estimation accuracy increases considerably, the number of defects introduced per 1,000 lines of code (KLOC) decreases by a factor of two, the number of defects per KLOC to be found late during development (i.e., in test) decreases by a factor of three or more, and productivity is not reduced
What is problem/issue? C2: If a specific hypothesis is being tested, state it clearly prior to performing the study and discuss the theory from which it is derived, so that its implications are apparent. The experiment investigated the following hypotheses (plus a few less important ones not discussed here, see [11]): . Reliability. PSP-trained programmers produce a more reliable program for the phoneword task than non-PSP-trained programmers. . Estimation Accuracy. PSP-trained programmers estimate the time they need for solving the phoneword task more accurately than non-PSP-trained programmers.
Exp Context Guidelines C1: Be sure to specify as much of the industrial context as possible. In particular, clearly define the entities, attributes, and measures that are capturing the contextual information.
Exp Context Guidelines C3: If the research is exploratory, state clearly and, prior to data analysis, what questions the investigation is intended to address and how it will address them. C4: Describe research that is similar to, or has a bearing on, the current research and how current work relates to it.
Exp Design Guidelines D1: Identify the population from which the subjects and objects are drawn. D2: Define the process by which the subjects and objects were selected. D3: Define the process by which subjects and objects are assigned to treatments.
Exp Design Guidelines D4: Restrict yourself to simple study designs or, at least, to designs that are fully analyzed in the statistical literature. If you are not using a well-documented design and analysis method, you should consult a statistician to see whether yours is the most effective design for what you want to accomplish.
Exp Design Guidelines D7: Use appropriate levels of blinding. D8: If you cannot avoid evaluating your own work, then make explicit any vested interests (including your sources of support) and report what you have done to minimize bias. D9: Avoid the use of controls unless you are sure the control situation can be unambiguously defined.
Exp Design Guidelines D10: Fully define all treatments (interventions). D11: Justify the choice of outcome measures in terms of their relevance to the objectives of the empirical study.
Conduct and collect DC1: Define all software measures fully, including the entity, attribute, unit and counting rules. DC2: For subjective measures, present a measure of interrater agreement, such as the kappa statistic or the intraclass correlation coefficient for continuous measures. DC3: Describe any quality control method used to ensure completeness and accuracy of data collection.
Conduct and collect DC4: For surveys, monitor and report the response rate and discuss the representativeness of the responses and the impact of nonresponse. DC5: For observational studies and experiments, record data about subjects who drop out from the studies. DC6: For observational studies and experiments, record data about other performance measures that may be affected by the treatment, even if they are not the main focus of the study.
Analysis A1: Specify any procedures used to control for multiple testing. A2: Consider using blind analysis. A3: Perform sensitivity analyses.
Analysis A4: Ensure that the data do not violate the assumptions of the tests used on them. A5: Apply appropriate quality control procedures to verify your results. A3: Perform sensitivity analyses.
Presentation P1: Describe or cite a reference for all statistical procedures used. P2: Report the statistical package used. P3: Present quantitative results as well as significance levels. Quantitative results should show the magnitude of effects and the confidence limits. P4: Present the raw data whenever possible. Otherwise, confirm that they are available for confidential review by the reviewers and independent auditors. P5: Provide appropriate descriptive statistics. P6: Make appropriate use of graphics.
Interpretation I1: Define the population to which inferential statistics and predictive models apply. I2: Differentiate between statistical significance and practical importance. I3: Define the type of study. I4: Specify any limitations of the study.
For Thurs 9/19 • Smith, Hale and Parrish, “An Empirical Study Using Task Assessment to Improve the Accuracy of Software Effort Estimation”, IEEE TOSE Mar 2001