Download
1 / 14
140 likes | 146 Views
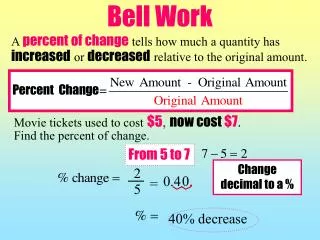
Bell Work. Write down 20 random numbers between 1-100. Find the Mean, Median, and Mode of your data set you just wrote down. Different Ways to Represent Data. It’s all about reppin ’ your data. Goal. To compare data sets using three different types of graphs. Directions.

E N D
Bell Work Write down 20 random numbers between 1-100. Find the Mean, Median, and Mode of your data set you just wrote down.
Different Ways to Represent Data It’s all about reppin’ your data
Goal • To compare data sets using three different types of graphs.
Directions • Each group will be given a data set (list of numbers) • The data set will represent something from life. • Bar graph • Scatter Plot • Box-whisker
Directions • Each graph will have… • The necessary parts labeled correctly • The mean, median and mode pointed out Posters: • Will be organized • Have decorations that match the theme of the data set
Directions • Presenting the posters: • Two days from today • Each person must participate • Each graph must be explained • Explain how each graphs shows the mean, median and mode of the data set
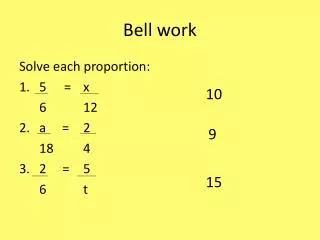
Sample: Mean • 6, 17, 24, 35, 3, 5, 36, 42, 13, 6 • The mean you know how to find. Add up and divide by the quantity of the data set. • 6+17+24+35+3+5+36+42+13+6 = 18.7 10
Median • 3, 5, 6, 6, 13, 17, 24, 35, 36, 42 • Median – What is the middle number • The middle is “13 , 17” …what now? • If it is two numbers you add and divide by two. = 15
Mode • 3, 5, 6, 6, 13, 17, 24, 35, 36, 42 • The data that occurs the most frequently • What is this one? • Mode = 6
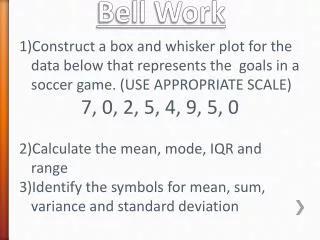
Box and Whisker • Box and Whisker • 5 things you need to find to make a box and whisker • Median “Q2” • Median of lower half of data “Q1” • Median of upper half of data “Q3” • Lowest number in data • Highest number in data
Upper half median Lower half median Median Q1 Q2 Q3 Lowest Highest
Bar graph • Leave the numbers in the order you were given them!!!! • Do not rearrange them least to greatest.
Scatter Plot • Leave the numbers in the order you were given them!!!! • Do not rearrange them least to greatest.
Breaking up into Groups • I will assign the groups • No you cannot change groups. • Your job • Make a poster showing your data with 3 different graphs, all labeled correctly • Two days from today you will present your posters to the class