Download
1 / 52
520 likes | 723 Views
LibQUAL + Survey Administration January 18, 2017. Welcome. Amy Yeager Association of Research Libraries Michael Maciel Texas A&M University. Association of Research Libraries. Agenda. Introduction to LibQUAL + and LibQUAL + Lite

E N D
LibQUAL+ Survey Administration January 18, 2017
Welcome • Amy Yeager • Association of Research Libraries • Michael Maciel • Texas A&M University Association of Research Libraries
Agenda • Introduction to LibQUAL+ and LibQUAL+ Lite • Using the LibQUAL+ platform to administer your survey • LibQUAL+ at Texas A&M University Libraries • Survey planning and preparation • Survey analysis preview • Q & A Association of Research Libraries
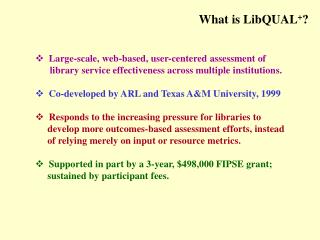
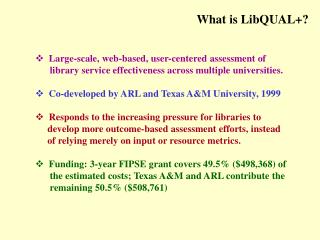
LibQUAL+ • Web-based customer survey • Internationally renown • Robust • Expectations & perceptions • Standardized Association of Research Libraries
Dimensions of Library Service Quality Library Service Quality Affect of Service Information Control Scope of Content Empathy Responsiveness Convenience Library as Place Assurance Ease of Navigation Utilitarian Space Reliability Timeliness Symbol Equipment Refuge Self-Reliance Association of Research Libraries
Survey Composition • 22 core questions in three dimensions: Affect of Service, Information Control, and Library as Place • 5 optional questions • Information literacy questions • General satisfaction questions • Library usage questions • Demographics • Free-text comments box Association of Research Libraries
LibQUAL+ Lite • Sampling Methodology: • All questions asked • Respondents answer a random sample only • Reduced survey time • Increased response rates Association of Research Libraries
LibQUAL+ Lite • Survey Composition: • 8 core questions • 1 local question • 1 information literacy question • 2 general satisfaction questions • All 3 library usage items • Demographics • Free-textcomments box Association of Research Libraries
Three Scales • For the 22 core and 5 optional questions, respondents are asked to rate on a scale of 1 – 9: • Their minimumservice level • Their desiredservice level • The library’s perceivedservice performance Association of Research Libraries
Key Terms • Zone of Tolerance: • The range between the Minimum and Desired mean scores • Adequacy Mean: • Perceived minus Minimum • Superiority Mean: • Perceived minus Desired Association of Research Libraries
Key Terms Zone of Tolerance 2 7 1 3 4 5 6 8 9 Adequacy Mean Superiority Mean Minimum Mean Desired Mean Perceived Mean Question 1
Survey Administration: Dashboard • Four Stages • Pre-launch • Monitor Survey Progress • Close Your Survey • Post-Survey and Results Association of Research Libraries
Stage 1 Association of Research Libraries
Configure Your Survey: Customization • Logo • Lite percentage • Dates • Incentives • Optional items: Age, Sex, and Full-time/part-time student status Always save your work Association of Research Libraries
Optional (Local) Questions Association of Research Libraries
Configuring Demographic Questions: Positions • Results notebooks summarize findings by Position (user group) • Can be customized with your local terminology • “Parent” categories (e.g., Undergraduate, Graduate, Faculty) • User subgroups (e.g., First year, Doctoral, Associate Professor). These are the response options your users can select. Association of Research Libraries
Positions • Only User Subgroup options can be selected by respondents. Categories (Parents) Response options (User Subgroups) Association of Research Libraries
Positions Customizable text (Parent options) Map to reporting value • Peer comparisons • Display on questionnaire Customizable text (User Subgroups) Association of Research Libraries
Positions • Cautions • Only User Subgroup options can be selected by participants • You must have at least one User Subgroup option for each Parent category • Need to provide population data for each User Subgroup Association of Research Libraries
Branch Library Options The library that you use most often: Association of Research Libraries
Disciplines • Standard disciplines (based on your institution type, i.e., College/University) • Customize with your local terminology • Recommend no more than 16 disciplines, if possible • For each user group, results notebooks provide a chart for both standard and custom disciplines Association of Research Libraries
Disciplines Association of Research Libraries
Stage 1 – Preview Your Survey and Launch • Preview • Test in different settings, using different platforms and Web browsers • Get library staff involved in testing • Complete and submit at least one full run of your preview survey Launch • Can no longer make changes • Irreversible step Association of Research Libraries
Stage 2 – Monitor Survey Progress – Association of Research Libraries
Stage 2 – Representativeness Questionnaire • Enter population data for user groups • Determines how your institutional profile compares to your survey data • Library statistics help identify peer institutions Association of Research Libraries
Stage 3 – Close Your Survey – Association of Research Libraries
Stage 4 – Post-Survey and Results • Raw data files • Comments • Incentive e-mail list • Post hoc questionnaire • Evaluation questionnaire Association of Research Libraries
Results Notebook • Sections for Overall*, Undergraduates, Graduate Students, Faculty, Staff, Library Staff include: • Demographic summary • Representativeness analysis for Undergraduates, Graduate Students, Faculty • Core questions summary • Dimensions summary • Local questions • General satisfaction questions • Information literacy outcomes questions • Library use summary • *excluding Library Staff Association of Research Libraries
Stage 4 – Incentive E-mails – Association of Research Libraries
Additional Services • LibQUALmembership subscription • Print copies • Library branch analysis • Customized discipline analysis • User subgroup analysis • Other customized analyses Association of Research Libraries
LibQUAL+ Survey Conducting the Survey TODAY’S PRESENTATION To Do List Analytic Tools Michael L. Maciel Texas A&M University Libraries maciel@tamu.edu
LibQUAL+ Survey Conducting the Survey TEXAS A&M UNIVERSITY LIBRARIES & the LibQUAL+ SURVEY AFFECT OF SERVICE CUSTOMER TREATMENT JOB KNOWLEDGE INFORMATION CONTROL INFORMATION RESOURCES INFORMATION ACCESSIBILITY LIBRARY AS PLACE LIBRARY ENVIRONMENT QUIET AND GROUP STUDY • 1999: Research began at Texas A&M University as part of • ARL’s New Measures Initiative • 2000-2001: Research continued with grants from the • National Science Foundation and the DoE Fund for the Improvement of Postsecondary Education • Results from LibQUAL+ Findings have include: • Improvement in first-year library orientation programs • Ongoing development of information literacy program and metrics • Development of customer service training program modeled after Disney Leadership Institute • Improvement in OPAC and online resource accessibility and use • Improvement in website self-discovery • Identification of key serials for current and emerging programs • Renovation of library facilities • Repair and replacement of library furnishings • Hours of operation • Electrical outlets Michael L. Maciel Texas A&M University Libraries maciel@tamu.edu 32 Association of Research Libraries
LibQUAL+ Survey Before the survey POPULATION SAMPLE • Recommendation: • Unless you are conducting the survey annually invite all students and faculty to participate • Other Populations: • University Administration • Library Staff 33
LibQUAL+ Survey Before the survey IRB • Publish………….. Non-Exempt • Do Not Publish….Exempt
LibQUAL+ Survey Before the survey LIBRARY PERSONNEL PREPARATION • Schedule Meetings with Liaisons • Schedule Meetings with Public Service Personnel • Announce at Library Wide Meeting • Send out eMail to Library Personnel • Consider Local Questions 35
LibQUAL+ Survey Before the survey UNIVERSITY PREPARATION • eMail Texts • Tie to Institutional Goals and Objectives • Create a Library Dean eMail Account • Invitation Texts • Reminder Texts • Ask Liaisons to send out • announcements • Listserv Texts • Tie to Institutional • Goals and Objectives • Invitation Texts • Reminder Texts 36
LibQUAL+ Survey Before the survey UNIVERSITY PREPARATION • Consider a Simple URL Link • e.g. library.tamu.edu/survey • Table Tents • Electronic Signage • Library Facilities • Campus Facilities
LibQUAL+ Survey Before the survey SCHEDULING THE SURVEY • Check with University: • Are other institution-wide surveys are being conducted? • Peak Survey Season is usually October-November • Can you find another time to conduct? • Length of Survey: 30-60 days • Reminders • Deliver Mid-Morning • Initial Invitation • First reminder (Tuesday/Wednesday survey mid-point) • Final reminder (Thursday before survey ends) • Begin Survey on a Tuesday or Wednesday 38
LibQUAL+ Survey During the survey MONITOR RESPONSES • Review Responses by User Groups and Colleges • First and Final Reminder • Wait for peak to conclude to before sending out • Adjust Reminder Texts if necessary • Monitor and Distribute Comments • When a library member is named send out “Kudos” • CC: Dean and other applicable personnel • (Coordinate with the Dean) • Close the Survey on a Monday or Tuesday 39
LibQUAL+ Survey After the survey DATA ANALYSIS • Resources • LibQUAL+ Analytics • For Your Library • To Compare to Other Libraries (w/Subscription) • Raw Data • Types of Analysis • Chart • Breakdown of Questions • For the Year • Overall, User Group, and College • Trends • Comments (overall) • Comments by specific population/service centers 40
LibQUAL+ Survey After the survey CORE QUESTION ORGANIZATION • AFFECT OF SERVICE • Customer Treatment • AS-2 Giving users individual attention • AS-3 Employees who are consistently courteous • AS-4 Readiness to respond to user’s questions • AS-6 Employees who deal with users in a caring fashion • AS-8 Willingness to help users • INFORMATION CONTROL • Information Resources • IC-3 The printed library materials I need for my work • IC-4 The electronic information resources I need • IC-8 Print/electronic journal collections I require for my work • LIBRARY AS A PLACE OF STUDY • Library Environment • LP-1 Library space that inspires study and learning • LP-3 A comfortable and inviting location • LP-4 A getaway for study, learning, or research • Job Expertise • AS-1 Employees who instill confidence in users • AS-5 Employees who have knowledge to answer user questions • AS-7 Employees who understand the needs of their users • AS-9 Dependability in handling users service problems • Information Accessibility • IC-1 Making electronic resources accessible from my home/office • IC-2 A library Web site enabling me to locate info on my own • IC-5 Modern equip that lets me easily access needed information • IC-6 Easy-to-use access tools allow me to find things on my own • IC-7 Making info easily accessible for independent use • Individual and Group Study • LP-2 Quiet space for individual activities • LP-5 Community space for group learning and group study
LibQUAL+ Survey After the survey TOP 5 LISTS: PRIORITIES, SUCCESSES, and CONCERNS Desired Score Priorities = Top Desired Scores Successes = Top Perceived Scores Concerns = Bottom AGR Scores Superiority Gap Perceived Score Zone of Tolerance Adequacy Gap Ratio = AGR AGR = Adequacy Gap ÷ Zone of Tolerance IF AGR > 100% ≡ Exceeding Expectations IF 100% ≤ AGR ≤ 50% ≡ Meeting Expectations IF 50% < AGR ≤ 0% ≡ Meeting Expectations but Monitor IF AGR < 0% ≡ Not Meeting Expectations Adequacy Gap Minimum Score 42
LibQUAL+ Survey After the survey TRENDING AND BENCHMARKING FACULTY IC-8 Print and/or electronic journal collections I require for my work ARL PERCEIVED SCORES 43
LibQUAL+ Survey After the survey ANALYSIS BY DISCIPLINE ALL USERS IC-1 Making electronic resources accessible from my home or office 44
LibQUAL+ Survey After the survey ANALYSIS BY DISCIPLINE 45
LibQUAL+ Survey After the survey ANALYSIS BY USER GROUP IC-2 A library Web site enabling me to locate information on my own 46
LibQUAL+ Survey After the survey COMMENTS ANALYSIS 47
LibQUAL+ Survey After the survey COMMENTS CODE BOOK • AFFECT OF SERVICE • Instruction • Job Expertise • Marketing • Reference • Treatment • INFORMATION RESOURCES • General • Identified Collection Gaps • Textbooks • INFORMATION ACCESSIBILITY • General • Format • Google Scholar • ILL/Document Delivery • Library Website/Search Efficacy • Multiple Copies • Policies/Fines • LIBRARY AS PLACE • Environment • Equipment • Food • Group/Individual Study • Hours • Noise/Quiet • Outlets • Space • Other 48
LibQUAL+ Survey After the survey RESULTS DISTRIBUTIONS • Keep It Simple • The Top 5 Lists • Where to Distribute • Library Wide • Library Administration • Service Personnel • Subject Liaisons • By Specific Populations • Colleges • Student Organizations 49
LibQUAL+ Survey After the survey TOP 5 LISTS FACULTY GRADUATES UNDERGRADUATES FACULTY GRADUATES UNDERGRADUATES CONCERNS – All AGR’s < 50% SUCCESSES PRIORITIES FACULTY GRADUATES UNDERGRADUATES 50