Download
1 / 14
140 likes | 301 Views
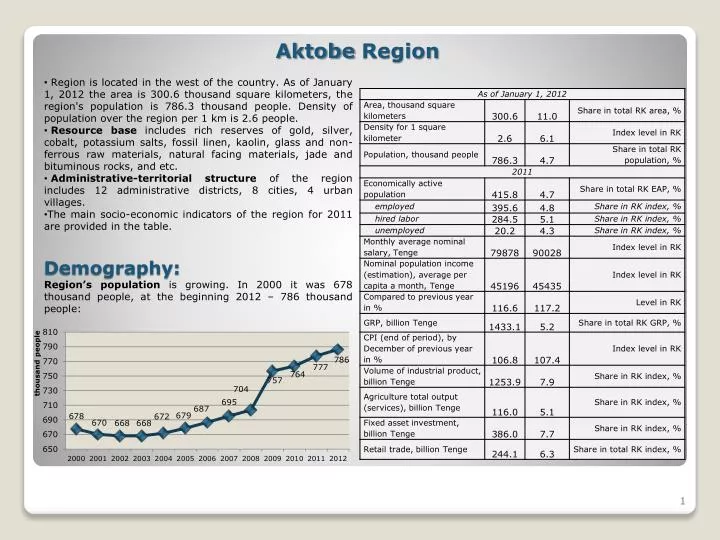
Aktobe Region. Region is located in the west of the country. As of January 1, 2012 the area is 300 . 6 thousand square kilometers, the region's population is 786 . 3 thousand people . Density of population over the region per 1 km is 2 . 6 people .

E N D
Aktobe Region • Region is located in the west of the country.As of January 1, 2012 the area is 300.6 thousand square kilometers, the region's populationis 786.3 thousand people. Density of population over the region per 1 km is 2.6 people. • Resource base includes rich reserves ofgold, silver, cobalt, potassium salts, fossil linen, kaolin, glass and non-ferrous raw materials, natural facing materials, jade and bituminous rocks, and etc. • Administrative-territorial structure of the region includes 12 administrative districts, 8 cities, 4 urban villages. • The main socio-economic indicators of the region for 2011 are provided in the table. Demography: Region’s population is growing. In 2000 it was 678 thousand people, at the beginning 2012– 786 thousand people: 1
Economically active population (EAP) • The number of employed population increases and unemployed population falls in both absolute and relative terms. For 10 years, from 2001 to 2011, the employed population has increased from 89 to 95%, while the number of unemployed has fallen from 11 to 5%. • Characteristic feature of the employed population dynamics is the growth of hired labor and the reduction of self-employed people. From 2001 to 2011 the number of hired labor has increased from 54% to 72%, the number of self-employed people has fallen from 46 to 28%. EAP and employed population structure corresponds to the average in Kazakhstan: EAP of the region is increasing at a moderate pace and in 2011 it reached 415.8 thousand people. 395.6 thousand people are employed, 20.2 thousand peopleare unemployed.Economically inactive population made up 152.2 thousand people, it is above the level in 2000:
The changes of employed population structure are supported by a strong tendency of unemployment rate reduction from 13.3% in 2000 to 4.9% in 2011 and constant level of economic activity of the population: • In 2011 unemployment rate of the region was slightly below the average in Kazakhstan – 5.4%: Unemployment Level
Quality of Life • Cost of living has been growing steadily since 2003, but the values are below the average in RK: • Life expectancy at birth in the region is increasing and the values are above the average in Kazakhstan: • Some of life quality indicators in 2011: • Share of population with income used for consumption below the poverty line is decreasingand it is below the average in Kazakhstan:
Enrollment • Enrollment share of the population aged 6-24 years was decreasing from 2005 and its values were below the average in RK in 2010 and 2011: • The number of children in regular preschools has significantly increased since 2001: • The number of students in technical and vocational education is increasing: • The number of students in higher educationhas been growing steadily since 2008, but the values are below the level of 2001-2006:
Monthly average nominal salary per employee for 2011 is 79,878 Tenge, that is below the country’s average – 90,028 Tenge: • In the dynamics, the average nominal salary per employee and the average nominal income per capita are ever-growing. • The index of the nominal and real incomes showed a decline during the crisisin 2009. In 2009 the growth of nominal income was less than the consumer price index, i.e. revenue growth did not cover inflation: Population Income
GRP growth in 2011 is slightly below the average growth of total GRP of all RK regions and makes up 125.9% compared to 2010, against the total value of RK - 126.4%: • GRPshows the growth in the dynamics either in absolute or in relative terms: Economy
Fixed assets investment tends to a stable significant growth: • The growth of fixed assets investmentin 2011 was below the total average levelin RK regions and made up 105.9% compared to previous year,against 107.7% in general in RK. This tendency can be explained by the base effectfrom the stronger decrease of investments in 2010 in the region compared toRK level: City of Almaty City of Astana East Kazakhstan North Kazakhstan Pavlodar South Kazakhstan Mangistau Kyzylorda Kostanay Karaganda Zhambyl West Kazakhstan Atyrau Almaty Aktobe Akmola • The share of fixed assets investment in the Kazakhstan’s level of investment has increased from 6.9% in 2000 to 7.7% in 2011: Investment
The volume of production in agriculture was increasing until 2009, decreased in 2010 to 82.3 billion Tenge: • The share of the region’s volume of production in agriculture in total Kazakhstan’s volume of industry’s production. In 2010 5.7% of country’s agricultural production was manufactured in the region: Agriculture
The growth of industrial production volumes was observed throughout the study period, excluding crisis year 2009, when the mining industry showed a decrease: • Real sector industries with the highest values of production in 2010 areproduction of crude oil and natural gas, construction, mining of metal ores, other mining industries, chemical industry, and etc. These industries have the significant share in the total production volume of RK and region’s GRP: • The share of industrial production in the Kazakhstan’s level has increasedfrom 5.2% in 2000 to 7.9% in 2011: Real Sector
Sector Enterprises • The number of industrial enterprises wasincreasinguntil 2008 and decreasing from 2008, however, its share in RK level has grown up: • The number of construction companies is increasing: • The number of working agricultural enterprises has been growing since 2009, however, its share has decreased from maximum 5.9% in 2003 to 4.6% in 2011:
Small and Medium Business • The number of registered legal entities as of October 1, 2012 is 12625. The SME number is 12528. The structure of the enterprises number is close to the RK average level: • SME share of the region's GRP is growing at a moderate pace, but it’s below the average level in RK:
Interbudgetary Relations • Budget revenues of Aktobe region in 2011 amounted to124.9 trillion Tenge, including 60.7 trillion Tenge of transfers from the national budget. Expenses amounted to 128.1 trillion Tenge, including 0,5 trillion Tenge of transfers to the national budget. Thus, the region is subventional:
Main target indicators: • GRP increase in real terms in 2015by 1.4 times compared to 2009 level; • An increase of the share of manufacturing industry in GRP to 13.1% in 2015 (2009 - 7.9%). • An increase of the share of local content in the procurement of goods of public institutions and organizations, strategic enterprises - up to 62%, procurement of works and services - more than 92%. • An increase of the share of non-resource exports in total exports - 45.5% by 2015 (2009 - 31.8%), including export in the agricultural sector to 2.53% by 2015 (2009 - 1.26%) . • Ensure the provision for the number of gasified settlements with the oil-associated (natural) gas to 51.3% of the total number of settlements by 2015. • An increase of the labor productivity in agriculture by 1.4 times by 2015 compared to 2009. • The life expectancy of the population in 2015 shall be 70.1 years (2009 - 68.19 years); • Total mortality in 2015 to be 7.62 per 1,000 people of the population (2009 - 8.46); • Coverage of preschool education and upbringing in educational institutions in 2015 shall be 98% (2009 - 64.3%); • Reduce the unemployment rate to 5.0% in 2015 (2009 - 6.0%); • Reduce the share of population with income below the minimum cost of living to 4.0% in 2015. (2009 - 6.3%); • Reduce energy intensity of GRP by 2015 at least by 10%; • Reduce emissions of air pollutants by 6.5% in 2015 compared to the level of 2009. Aktobe Region Development Program for 2011-2015