Download
1 / 28
280 likes | 391 Views
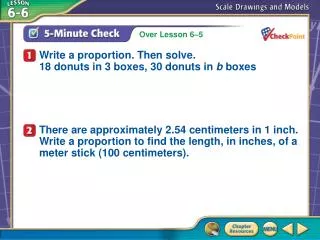
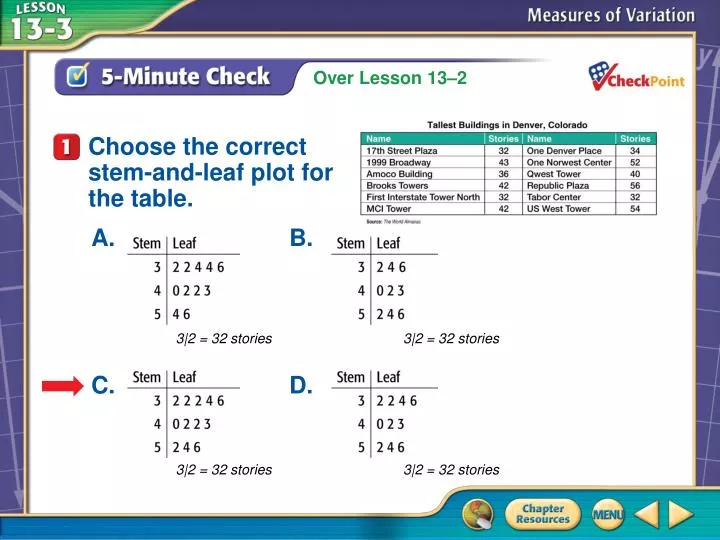
A B C D. A. B. C. D. 3 | 2 = 32 stories. 3 | 2 = 32 stories. 3 | 2 = 32 stories. 3 | 2 = 32 stories. Choose the correct stem-and-leaf plot for the table. 5-Minute Check 1. Splash Screen. You have already found measures of central tendency. (Lesson 13–2). Find measures of variation.

E N D
A B C D A.B. C.D. 3|2 = 32 stories 3|2 = 32 stories 3|2 = 32 stories 3|2 = 32 stories Choose the correct stem-and-leaf plot for the table. 5-Minute Check 1
You have already found measures of central tendency. (Lesson 13–2) • Find measures of variation. • Use measures of variation to interpret and analyze data. Then/Now
measures of variation used to describe the distribution of statistical data a measure of variation that is the difference between the least and greatest values in a data set • range • quartiles • lower quartile • upper quartile • interquartile range • outlier the values that divide a set of data into four equal parts the median of the lower half of a set of data (we use “LQ” for it) the median of the upper half of a set of data (we use “UQ” for it) the range of the middle half of a set of data (UQ – IQ) data that are more than 1.5 times the interquartile range beyond the quartiles (unusual values) Vocabulary
Stem 3 4 5 Leaf 3 3 5 7 7 8 0 3 3 4 9 4 9 3|5 = 35 hours Find Range A. Find the range of the set of data. Work Time The greatest value is 59 and the least is 33. Answer: The range is 59 – 33 or 26 hours. Example 1 A
Find Range B. Find the range of the set of data. The cost of jeans at a department store: $79, $42, $38, $51, $63, $91 The greatest value is $91 and the least is $38. Answer: The range is $91 – $38 or $53. Example 1 B
A B C D A.Find the range of the set of data.{14, 37, 82, 45, 24, 10, 75} A. 61 B. 65 C. 68 D. 72 Example 1 CYPA
A B C D Stem 5 6 7 Leaf 2 3 5 5 9 4 8 9 0 1 8 9 6|8 = 68 B.Find the range of the set of data. A. 27 B. 20 C. 18 D. 12 Example 1 CYPB
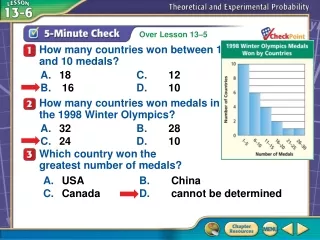
Identify Measures of Variation OLYMPICS Find the measures of variation for the data in the table. Step 1Range: 29 – 14 = 15 medals Example 2
lower quartile median upper quartile 14 14 19 22 23 24 25 29 Identify Measures of Variation Step 2 Median, Upper Quartile, Lower Quartile Order the data from least to greatest. Interquartile range: 24.5 – 16.5 or 8 Example 2
Identify Measures of Variation Answer:The range is 15. The median is 22.5, the lower quartile is 16.5 and the upper quartile is 24.5. The interquartile range is 8. Example 2
A B C D What are the range (R), interquartile range (IR), median (M), lower quartile (LQ), and upper quartile (UQ) for the data in the table? • A. R: 35, IR: 26, M: 23, LQ: 14.5, UQ: 40.5 • B. R: 35, IR: 26.5, M: 24, LQ: 14, UQ: 40.5 • R: 32, IR: 26, M: 24, LQ: 14.5, UQ: 40.5 • R: 35, IR: 12.5, M: 23, LQ: 16, UQ: 28.5 Example 2 CYP
lower quartile median upper quartile 2.5 3 3 4.5 5 5 6 8 14 Find Outliers NUTRITION Find any outliers in the data set. Step 1Find the interquartile range. The interquartile range is 7 – 3 = 4. Example 3
Find Outliers Step 2Multiply the interquartile range by 1.5. 1.5 ● 4 = 6 Step 3Subtract 6 from the lower quartile and add 6 to the upper quartile. 3 – 6 = –3 7 + 6 = 13 Answer:The only outlier is 14 because it is greater than 13. Example 3
A B C D Find any outliers in the data set. • 49 is the only outlier. • B. 49 and 15 are outliers. • C. 15 is the only outlier. • D. There are no outliers. Example 3 CYP
Use Measures of Variation SOCCER The table shows the number of tickets sold to soccer games at a local stadium. Use the measures of variation to describe the data. Find the measures of variation. The range is 301 – 98 = 203. Example 4
Use Measures of Variation The interquartile range is 274 – 184 or 90. Answer:The spread of the data is 203 tickets. The median number of tickets is 241. The least fourth of the ticket sales is 184 tickets or less. The greatest fourth of ticket sales is 274 or more. The number of tickets sold for half of the games was between 184 and 274. Example 4
A B C D On the chart below, Mark kept track of the number of hours he exercised. Which statement is not true? A. The spread of the data was 1.05 hours. B. The median number of hours was 0.59 hour. C. The greatest fourth of time was 0.66 hour or more. D. The number of hours exercised for half of the time was between 0.5 hour and 0.66 hour. Example 4 CYP
Western States 4 3 2 2 2 2 1 5 4 Eastern States 6 6 7 8 0 3 4 5 7 0 0 1 2 2|0 = 2% 2|7 = 27% Measures of Variation A.LAND USE The urban land in certain Western and Eastern states is listed below as the percent of each state’s total land, rounded to the nearest percent.Compare the western states’ range with the eastern states’ range. Example 5A
Measures of Variation Answer: The range for the western states is 4%. The range for the eastern states is 21%. The percents of urban land use in the East vary more. Example 5A
Western States 4 3 2 2 2 2 1 5 4 Eastern States 6 6 7 8 0 3 4 5 7 0 0 1 2 2|0 = 2% 2|7 = 27% Measures of Variation B.LAND USE The urban land in certain Western and Eastern states is listed below as the percent of each state’s total land, rounded to the nearest percent. Does the data for either region contain an outlier? Example 5B
Measures of Variation Western States Eastern States Lower Quartile: 2 6.5 Upper Quartile: 4 14.5 Interquartile Range: 4 – 2 = 2 14.5 – 6.5 = 8 Multiply by 1.5: 2 ● 1.5 = 3 8 ● 1.5 = 12 Determine Outliers: 2 – 3 = –1 x 6.5 – 12 = –5.5 x 4 + 3 = 7 x 14.5 + 12 = 26.5 Answer: There are no outliers for the western states. Since 27 is greater than 26.5, 27 is an outlier for the eastern states. Example 5B
Western States 4 3 2 2 2 2 1 5 4 Eastern States 6 6 7 8 0 3 4 5 7 0 0 1 2 2|0 = 2% 2|7 = 27% Measures of Variation C.LAND USE The urban land in certain Western and Eastern states is listed below as the percent of each state’s total land, rounded to the nearest percent. How does the outlier affect the measures of central tendency for the Eastern States? Example 5C
Measures of Variation Calculate the mean, median, and mode without the outlier, 27, in the data for the eastern states. without the outlier with the outlier median: 9 median: 10 mode: 6 mode: 6 Answer: The mean and median are higher with the outlier. The mode does not change. Example 5C
A B C D Teens 5 4 2 0 7 3 1 Twenties 0 4 6 7 9 0 2 2 5 0 3 4 5 8 0 1 2 3|1 = 13 hr 1|5 = 15 hr A. EXERCISE The hours per week spent exercising for teenagers and people in their twenties are listed in the stem-and-leaf plot.Compare the range for each set of data. A. teenagers: 21 hr; twenties: 28 hrThe hours of the twenties group vary more. B. teenagers: 15 hr; twenties: 16 hrThe hours of the twenties group vary only slightly more. C. teenagers: 22.5 hr; twenties: 24 hrThe hours of the twenties group vary only slightly more. D. teenagers: 5 hr; twenties: 12 hrThe hours of the twenties group vary more. Example 5 CYP B
A B C D Teens 5 4 2 0 7 3 1 Twenties 0 4 6 7 9 0 2 2 5 0 3 4 5 8 0 1 2 3|1 = 13 hr 1|5 = 15 hr B. EXERCISE The hours per week spent exercising for teenagers and people in their twenties are listed in the stem-and-leaf plot.Does the data for either group contain an outlier? A. yes; teens B. yes; twenties C. yes; both groups contain an outlier. D. No; neither group contains an outlier. Example 5 CYP B