Download
1 / 1
10 likes | 87 Views
Figure 1. Predicted and actual evolutionary response of diamondback moth.

E N D
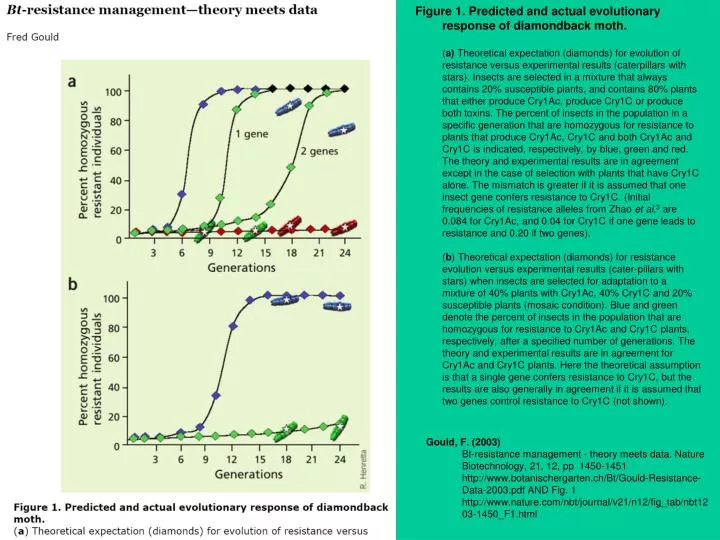
Figure 1.Predicted and actual evolutionary response of diamondback moth. (a) Theoretical expectation (diamonds) for evolution of resistance versus experimental results (caterpillars with stars). Insects are selected in a mixture that always contains 20% susceptible plants, and contains 80% plants that either produce Cry1Ac, produce Cry1C or produce both toxins. The percent of insects in the population in a specific generation that are homozygous for resistance to plants that produce Cry1Ac, Cry1C and both Cry1Ac and Cry1C is indicated, respectively, by blue, green and red. The theory and experimental results are in agreement except in the case of selection with plants that have Cry1C alone. The mismatch is greater if it is assumed that one insect gene confers resistance to Cry1C. (Initial frequencies of resistance alleles from Zhao et al.3 are 0.084 for Cry1Ac, and 0.04 for Cry1C if one gene leads to resistance and 0.20 if two genes). (b) Theoretical expectation (diamonds) for resistance evolution versus experimental results (cater-pillars with stars) when insects are selected for adaptation to a mixture of 40% plants with Cry1Ac, 40% Cry1C and 20% susceptible plants (mosaic condition). Blue and green denote the percent of insects in the population that are homozygous for resistance to Cry1Ac and Cry1C plants, respectively, after a specified number of generations. The theory and experimental results are in agreement for Cry1Ac and Cry1C plants. Here the theoretical assumption is that a single gene confers resistance to Cry1C, but the results are also generally in agreement if it is assumed that two genes control resistance to Cry1C (not shown). • Gould, F. (2003) • Bt-resistance management - theory meets data. Nature Biotechnology, 21, 12, pp 1450-1451 • http://www.botanischergarten.ch/Bt/Gould-Resistance-Data-2003.pdf AND Fig. 1 http://www.nature.com/nbt/journal/v21/n12/fig_tab/nbt1203-1450_F1.html