Download
1 / 1
10 likes | 61 Views
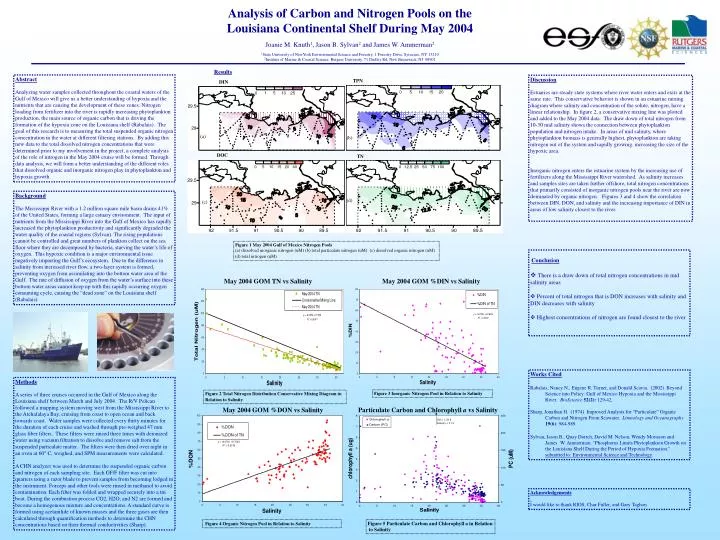
Analysis of Carbon and Nitrogen Pools on the Louisiana Continental Shelf During May 2004 Joanie M. Knuth 1 , Jason B. Sylvan 2 and James W. Ammerman 2 1 State University of NewYork Environmental Science and Forestry, 1 Forestry Drive, Syracuse, NY 13210

E N D
Analysis of Carbon and Nitrogen Pools on the Louisiana Continental Shelf During May 2004 Joanie M. Knuth1, Jason B. Sylvan2 and James W. Ammerman2 1State University of NewYork Environmental Science and Forestry, 1 Forestry Drive, Syracuse, NY 13210 2Institute of Marine & Coastal Science, Rutgers University, 71 Dudley Rd, New Brunswick, NJ 08901 Results Abstract Analyzing water samples collected throughout the coastal waters of the Gulf of Mexico will give us a better understanding of hypoxia and the nutrients that are causing the development of these zones. Nitrogen loading from fertilizer into the river is rapidly increasing phytoplankton production, the main source of organic carbon that is driving the formation of the hypoxia zone on the Louisiana shelf (Rabalais). The goal of this research is to measuring the total suspended organic nitrogen concentration in the water at different filtering stations. By adding this new data to the total dissolved nitrogen concentrations that were determined prior to my involvement in the project, a complete analysis of the role of nitrogen in the May 2004 cruise will be formed. Through data analysis, we will form a better understanding of the different roles that dissolved organic and inorganic nitrogen play in phytoplankton and hypoxia growth. Discussion Estuaries are steady state systems where river water enters and exits at the same rate. This conservative behavior is shown in an estuarine mixing diagram where salinity and concentration of the solute, nitrogen, have a linear relationship. In figure 2, a conservative mixing line was plotted and added to the May 2004 data. The draw down of total nitrogen from 10-30 mid salinity shows the connection between phytoplankton population and nitrogen intake. In areas of mid salinity, where phytoplankton biomass is generally highest, phytoplankton are taking nitrogen out of the system and rapidly growing. increasing the size of the hypoxic area. Inorganic nitrogen enters the estuarine system by the increasing use of fertilizers along the Mississippi River watershed. As salinity increases and samples sites are taken further offshore, total nitrogen concentrations that primarily consisted of inorganic nitrogen pools near the river are now dominated by organic nitrogen. Figures 3 and 4 show the correlation between DIN, DON, and salinity and the increasing importance of DIN in areas of low salinity closest to the river. TPN DIN (a) (b) DOC TN Background The Mississippi River with a 1.2 million square mile basin drains 41% of the United States, forming a large estuary environment. The input of nutrients from the Mississippi River into the Gulf of Mexico has rapidly increased the phytoplankton productivity and significantly degraded the water quality of the coastal regions (Sylvan). The rising populations cannot be controlled and great numbers of plankton collect on the sea floor where they are decomposed by bacteria, starving the water’s life of oxygen. This hypoxic condition is a major environmental issue negatively impacting the Gulf’s ecosystem. Due to the difference in salinity from increased river flow, a two-layer system is formed, preventing oxygen from assimilating into the bottom water area of the Gulf. The rate of diffusion of oxygen from the water’s surface into these bottom water areas cannot keep up with this rapidly occurring oxygen consuming cycle, causing the “dead zone” on the Louisiana shelf (Rabalais). (d) (c) Figure 1 May 2004 Gulf of Mexico Nitrogen Pools (a) dissolved inorganic nitrogen (uM) (b) total particulate nitrogen (uM) (c) dissolved organic nitrogen (uM) (d) total nitrogen (uM) • Conclusion • There is a draw down of total nitrogen concentrations in mid salinity areas • Percent of total nitrogen that is DON increases with salinity and DIN decreases with salinity • Highest concentrations of nitrogen are found closest to the river May 2004 GOM TN vs Salinity May 2004 GOM %DIN vs Salinity Works Cited Rabalais, Nancy N., Engene R. Turner, and Donald Scavia. (2002) Beyond Science into Policy: Gulf of Mexico Hypoxia and the Mississippi River. BioScience52(2): 129-42. Sharp, Jonathan H. (1974) Improved Analysis for “Particulate” Organic Carbon and Nitrogen From Seawater.Limnology and Oceanography 19(6): 984-989. Sylvan, Jason B., Quay Dortch, David M. Nelson, Wendy Morisson and James W. Ammerman. "Phosphorus Limits Phytoplankton Growth on the Louisiana Shelf During the Period of Hypoxia Formation." submitted to: Environmental Science and Technology. Methods A series of three cruises occurred in the Gulf of Mexico along the Louisiana shelf between March and July 2004. The R/V Pelican followed a mapping system moving west from the Mississippi River to the Atchafalaya Bay, cruising from coast to open ocean and back towards coast. Water samples were collected every thirty minutes for the duration of each cruise and washed through pre-weighed 47 mm glass fiber filters. These filters were rinsed three times with deionized water using vacuum filtration to dissolve and remove salt from the suspended particulate matter. The filters were then dried over night in an oven at 60 C, weighed, and SPM measurements were calculated. A CHN analyzer was used to determine the suspended organic carbon and nitrogen of each sampling site. Each GF/F filter was cut into quarters using a razor blade to prevent samples from becoming lodged in the instrument. Forceps and other tools were rinsed in methanol to avoid contamination. Each filter was folded and wrapped securely into a tin boat. During the combustion process CO2, H2O, and N2 are formed and become a homogenous mixture and concentrations. A standard curve is formed using acetanilide of known masses and the three gases are then calculated through quantification methods to determine the CHN concentrations based on their thermal conductivities (Sharp). Figure 3 Inorganic Nitrogen Pool in Relation to Salinity Figure 2 Total NitrogenDistributionConservative Mixing Diagram in Relation to Salinity May 2004 GOM %DON vs Salinity Particulate Carbon and Chlorophyll a vs Salinity Chl a = 26.8 Salinity = 21.9 Acknowledgements I would like to thank RIOS, Char Fuller, and Gary Taghon Figure 5 Particulate Carbon and Chlorophyll a in Relation to Salinity Figure 4 Organic Nitrogen Pool in Relation to Salinity