Download
1 / 28
280 likes | 282 Views
This presentation summarizes the results of a study on the impacts of particulate matter (PM) traps on near-field nitrogen dioxide (NO2) emissions from diesel engines. The study focuses on idling school buses and high volume freeways. The results show the potential reduction in NO2 levels with the use of PM traps.

E N D
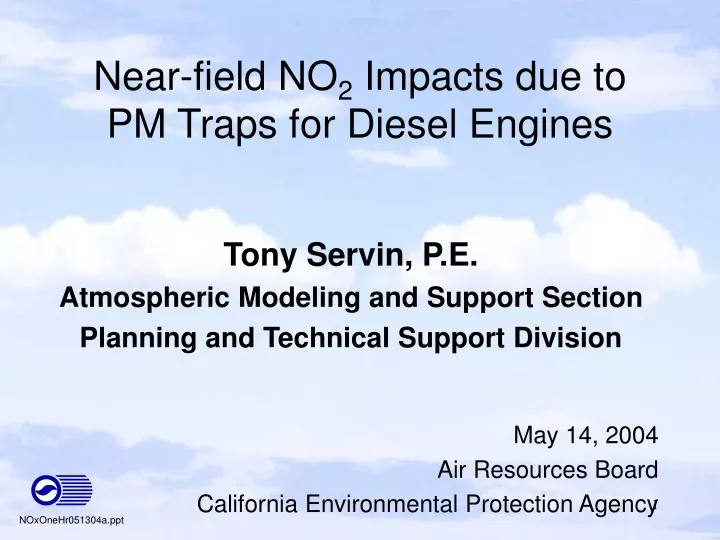
Near-field NO2 Impacts due to PM Traps for Diesel Engines Tony Servin, P.E. Atmospheric Modeling and Support Section Planning and Technical Support Division May 14, 2004 Air Resources Board California Environmental Protection Agency NOxOneHr051304a.ppt
Presentation Format • Summary of Nearfield NO2 Results • Idling School Buses Details • High Volume Freeway Details
NOx Emission Source Configurations • Scenarios • Idling School Buses (20 buses) • High Volume Freeway (26,312 trucks/day) • Consistent with… Risk Reduction Plan to Reduce Particulate Matter Emissions from Diesel-Fueled Engines and Vehicles, Air Resources Board, 2000
Old / Screening PM Traps: No 10% NO2/NOx PM Traps: Yes 50% NO2/NOx 90% Penetration 2010 Fleet Ozone Limiting Method Screening Level Analysis w/ High Ambient Data New / Refined PM Traps: No 10% NO2/NOx PM Traps: Yes 40% NO2/NOx 90% Penetration 2010 Fleet Ozone Limiting Method Refined: Hourly Ambient Data to Estimate NO2 from NOx Model Assumptions for NOx Exhaust Emissions
Idling School Buses • 20 buses queued 5 at a time • Five minute idle time • Idle at 8 am and 2 pm • NOx emissions (EMFAC2002 V2.2) • Idle: 80.7 g/hr • Running 17.9 g/mile at 5 mph for 60 m • Hourly Ambient Data and Met. Data • 2002 Los Angeles North Main • ISCST3 Model with Rural Dispersion
Idling School Buses - 1-Hour Results3 Highest Above Ambient Impacts + Ambient
High Volume Freeway • 26,312 trucks per day average • 99th percentile for 2000 in California • 189,936 vehicle per day total weekday • NOx emissions (EMFAC2002 V2.2) • vehicle type, vehicle speed, ambient temperature, and relative humidity • 2010 fleet emissions with 90% penetration • Hourly Ambient Data and Met. Data • 2002 North Long Beach • CAL3QHCR
Weekday Diurnal Traffic Volume 189,936 vehicles per day (Caltrans 2000)
Weekend Diurnal Traffic Volume 117,262 vehicles per day (Caltrans 2000)
Long Beach Freeway Vehicle Speed (Caltrans)
Table 3 – Refined 1-Hour NO2 Impacts for High Volume Freeway Particulate Control Maximum (b) Note W/O Traps (10% NO2) 150 ppb (a) W/Traps (40% NO2) 180 ppb (a) Notes: (a) One Hour California State Standard for NO2 is 250 ppb (b) Ambient NO2 is included as background High Volume Freeway 1-Hour Results
High Vol. Freeway - 1-Hour Results3 Highest Above Ambient Impacts + Ambient
Table 4 – Screening Above Ambient Annual Average NO2 Impacts for High Volume Freeway Particulate Control Maximum (b) Note W/O Traps (10% NO2) 18 ppb (a) W/Traps (50% NO2) 18 ppb (a) Notes: (a) Annual Average Federal Standard is 53 ppb NO2 (b) Receptor located 20 meters from edge of freeway High Volume Freeway Annual Screening Results
Table 5 – Summary of 1-Hour NO2 Impacts due to Particulate Traps (a), (b) Scenario PM Traps: No (10% NO2/NOx) PM Traps: Yes (40% NO2/NOx) Idling School Buses(c) 120 ppb 170 ppb Freeway (d) 150 ppb 180 ppb • (a)These results include ambient hourly NO2 as background. • (b)The California State standard for 1-Hr NO2 is 250 ppb. • (c)Idling School Buses include 20 buses idling for 5 minutes with hourly O3. • (d)High Volume Freeway is for 26,312 trucks per day with hourly O3. Summary – 1 Hr NO2