Download

1 / 24
240 likes | 466 Views
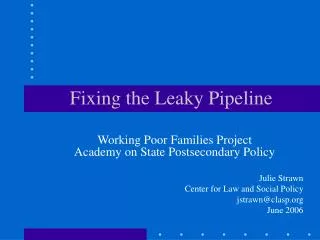
Leaky Education Pipeline. Of every 100 students who enter kindergarten: 71 graduate from high school 42 enter a community college or university 18 receive a diploma within 6 years. Source: National Collaborative for Post-Secondary Educational Policy

E N D
Leaky Education Pipeline Of every 100 students who enter kindergarten: • 71 graduate from high school • 42 enter a community college or university • 18 receive a diploma within 6 years Source: National Collaborative for Post-Secondary Educational Policy Data on students who transfer between post-secondary institutions is not available and therefore not included in this calculation
Current Early Learning Programs Only Serve Half of Eligible Low Income Children Sources: Early Childhood Education and Assistance Program, Washington State Community, Trade and Economic Development; Washington State Association of Head Start and ECEAP
Early Learning: A High Return on Investment 55% 48% Those who receivedpreschool program 36% 31% 25% Those who did not 14% Placed inSpecialEducation Held Backin grade Attended 4yrcollege Source: S. W. Barnett, “Long-Term Effects of Early Childhood Programs on Cognitive and School Outcomes”, The Future of Children, 1995.
Education Trust Fund • 10,000 new high quality early learning spaces for low-income children • Higher quality, better funded ECEAP program currently serving 6,000 children • New quality standards tied to learning outcomes
Meeting the Challenge ? Source: Office of the Superintendent of Public Instruction
Student Needs Have Escalated • English Language Learners • Special EducationStudents • Children in PovertyEligible for Free or Reduced Price Lunch Source: Office of the Superintendent of Public Instruction
K-12 Funding Erosion Washington’s per pupil expenditures from all sources compared to national average support * NCES estimates ** NCES data unavailable for 1981-85 Source: National Center for Education Statistics
National Benchmarking Total K-12 spending (all sources): • 1991-92 Washington ranked 17th in nation • 2000-01 Washington ranked 30th in nation K-12 per student funding (all sources) per $1000 of personal income • 1991-92 Washington ranked 24th in nation • 2000-01 Washington ranked 45th in nation Source: US Census Bureau
State Funding Erosion K-12 share of state operating budget – all funds K-12 share of state operating budget – general fund Source: Office of the Superintendent of Public Instruction
Education Trust Fund • Every student meeting today’s high standards • Fully fund I-728, as voters intended, for class size reduction, teacher training, and extended learning opportunities • New targeted funding based on poverty and bilingual needs • Every student, every school benefits
Education Trust Fund • Restore voter-approved pay raise for educators suspended in 2003-05 budget • Provide incentives for teachers to earn National Board Certification • Forgive teacher loans to encourage certification in high needs areas
Access Crisis 307,156 Projected current servicelevel for 2009-10 = 247,150 60,000 250,000 Growth to maintaincurrent participationrate: +33,517 200,000 Budgeted enrollmentfor2004-05 = 213,633 150,000 100,000 2004-05 2005-06 2006-07 2007-08 2008-09 2009-10 2020 Sources: 2003-05 Operating Budget; Office of Financial Management; 2020 commission
Education Trust Fund Increase opportunities for our students to go to community and technical colleges and universities • 25,000 state-funded enrollments • 7,000 high demand enrollments in fields such as nursing and engineering
Increase Financial Aid and Expand Assistance to High Achievers • Increase State Need Grant eligibility to students from families with less than 65% of the median family income • Extend Washington Promise Scholarship Program to top 30% of every high school graduating class
Education Trust Fund Principles • New dedicated revenue stream for education • Tough no-supplanting provisions • Greater collaboration, efficiency, and accountability • Strong citizen oversight
Education Trust Fund • Increase state sales tax rate from 6.5% to 7.5% • Voters believe that since everyone benefits from education, everyone should pay • Children can’t wait for the adults to reform our tax system
Education Investments Pay Off • Education benefits the individual in higher personal income • Education benefits society in more rapid economic growth • Social benefits include less crime, lower welfare costs, and higher tax receipts • The better the schools, the longer students continue their education and the greater the economic benefit
Economic Value of Education Source: 2000 U.S. Census
www.edtrustfund.org • info@edtrustfund.org • 206-728-6448 • PO Box 1727, Seattle, 98111