Download
1 / 17
180 likes | 292 Views
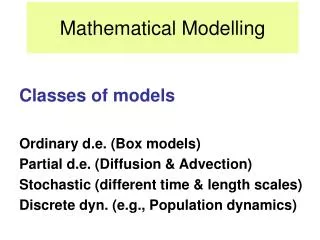
Mathematical Modelling of Weighted Networks. Orestis Chrysafis – Chris Cannings School Of Medicine & Biomedical Sciences, University Of Sheffield. The Model. Case Study. a) Strength evolution. a) Strength evolution. a) Strength evolution. Simulation parameter values:

E N D
Mathematical Modelling of Weighted Networks Orestis Chrysafis – Chris Cannings School Of Medicine & Biomedical Sciences, University Of Sheffield
a) Strength evolution • Simulation parameter values: • Network size: N=10,000 • δ=0.5 • f(δ)=δ/(δ+1) • Propagation steps: n=3 • No of edges per new node: m=2 • Data averaged over 100 runs
Simulation parameter values: • Network size: N=104 • δ=0.5 • f(δ)=δ/(δ+1) • Propagation steps: n=3 • No of edges per new node: m=1 • Data from single random realization of the network b) Strength-Degree Dependence
Simulation parameter values: N=104, δ=0.5, f(δ)=δ/(δ+1), n=3, m=1 Data averaged over 100 runs c) Degree Sequence
Parameter values: N=104, δ=0.5, f(δ)=δ/(δ+1), n=3, m=1, and the direction of the edges has been accounted for. The analytic formula does not factorise, thus nearest neighbour degree correlations form systematically.
d) Joint 2-node degree sequence Theoretical expectations for a small network with maximum degree dmax=60.
Simulation parameter values: N=104, δ=0.5, f(δ)=δ/(δ+1), n=3, m=2 Data averaged over 100 runs and binned logarithmically. e) Expected strength distribution
Acknowledgements Thanks to: Nick Monk David Irons The EPSRC