Download
1 / 34
340 likes | 346 Views
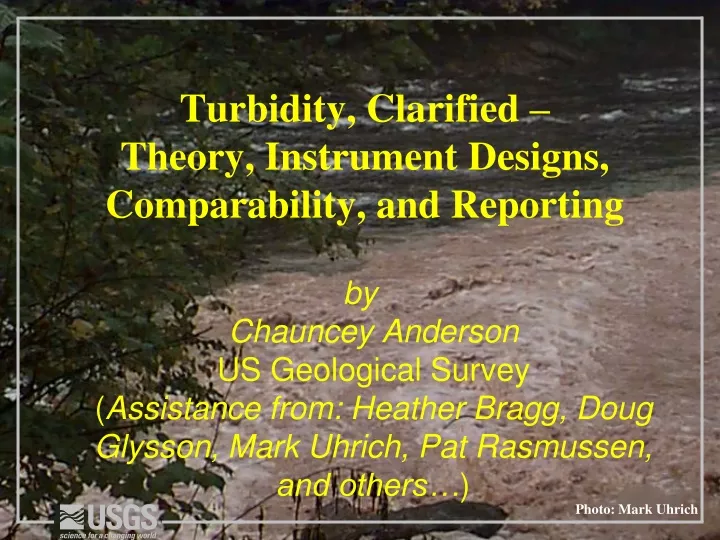
Turbidity, Clarified – Theory, Instrument Designs, Comparability, and Reporting. by Chauncey Anderson US Geological Survey ( Assistance from: Heather Bragg, Doug Glysson, Mark Uhrich, Pat Rasmussen, and others… ). Photo: Mark Uhrich. Outline. Problem / Definition Measurement & Technology

E N D
Turbidity, Clarified –Theory, Instrument Designs, Comparability, and Reporting byChauncey Anderson US Geological Survey(Assistance from: Heather Bragg, Doug Glysson, Mark Uhrich, Pat Rasmussen, and others…) Photo: Mark Uhrich
Outline • Problem / Definition • Measurement & Technology • Comparisons among instruments • Data Reporting and Database Issues • Lingering Challenges Photo: Chauncey Anderson
Turbidity – Definition “…an expression of the optical properties of a liquid that causes light rays to be scattered and absorbed rather than transmitted in straight lines through a sample.” (ASTM International, 2003a) • Suspended material • clay, silt, finely divided organic matter, plankton, other microscopic organisms • Dissolved material (e.g. color) • organic acids and dyes • Not a direct measurement of sediment concentration Photo: Kurt Carpenter
Turbidity – Uses / Objectives • Optical Clarity (E.g. Davies-Colley & Smith, 2001) • Surrogate for Concentration of suspended sediment and other parameters • Event notification • Trigger for monitoring • Source Identification • Regulatory
Light Scattering by particles • Function of • particle size • particle density • light wavelength Std. Methods for Examination of Water and Wastewater
Turbidity – Measurement (ATTENUATION) (WHITE OR NEAR-IR) 135o (BACKSCATTER)
Factors Affecting Turbidity Measurements • Inherent Sample Qualities • Particle size and shape • Color and reflectivity • Measurement Techniques • Light source (wavelength) • Sample handing (In-situ vs Benchtop) • Number and configuration of detectors • Calibration • Interferences • Mechanical & Sample problems (fouling, scratched optics, settling) • Bubbles • Stray Light • Instrument drift
Turbidity – Limitations • Operationally defined, not an inherent physical property • Susceptible to fouling, drift, & “pegging” • High natural variability in environmental settings • Spikey signal (consider smoothing algorithms) • Varies with streamflow, location in x-section, instream and upstream processes, particle type and density
500 (n = ~15) 400 300 Turbidity 200 100 0 1 2 3 600 mg/L 6-7% Sand 600 mg/L 20% Sand 150 mg/L 0% Sand Blind Sample Lot Problem: Large differences among instruments and users (Gray and Glysson, 2002)
Technology • Single Element Meters (SEMs) • Single detector, white light (standard nephelometry) • Near-IR nephelometry • Backscatter • Attenuation / Transmission • Surface Scatter • Multiple detectors (ratiometry) • White light or near-IR • Static (benchtop) vs in-situ (submersible)
Effect of Color 70 60 50 40 White-light, ratio (Hach 2100AN) 30 20 10 0 0 10 20 30 40 50 60 70 White Light, non-ratio (Hach 2100A) Data from Pavelich, NWQL
100 Analite 160 (near IR) Hach 2100P (White Light, Ratio) Hach 2100N (White Light, non-ratio) 80 x = y 60 Turbidity 40 20 0 0 20 40 60 80 100 YSI 6026 (near IR) Effect of Light Source & Detectors Source: Bragg, unpublished
Instrument Comparisons White Light, Ratio (static) Near-IR, Dynamic White Light (Static) Near IR, Static 80 70 60 50 40 30 20 1:00 3:00 5:00 7:00 9:00 11:00 13:00 15:00 17:00 19:00 21:00 23:00 Source: Ziegler, unpublished
Instrument Comparisons: YSI Probes 6026 6136 Conversion From YSI: 6136 value = 0.6486 * (6026 value) (caution in application elsewhere)
Upper Squaw Creek, 3-Sisters Wilderness, Oregon, August 2003 600 500 White-light, Ratio (Hach 2100P) 400 Turbidity 300 200 White-light, Non-ratio (Hach 2100N) 100 0 1 2 3 4 5 Subsample # Instrument Comparisons
Turbidity – Instrument Comparisons * Rarely 1:1 * Some nonlinear * Respond differently to different sediments Source: Lewis, Eads, and Klein, 2006 Hach 2100AN Hach 2100P YSI 6136 YSI 6026 Analite NEP395 DTS-12 OBS 3+ OBS 3
Different Sediments Produce Different Turbidities Lewis, Eads, and Klein, 2008
Potential for Inconsistencies Lewis, Eads, and Klein, 2007, http://www.fs.fed.us/psw/topics/water/tts/
3000 2500 2000 Turbidity 1500 Near IR (YSI 6026) 1000 500 0 Ratio Meter(Hach 2100AN) 1 3 5 7 9 11 13 Site Number Ratio Meter Diluted (Hach 2100 AN) 15 17 Effect of Dilutions
5000 1:1 Dilution 1:3 Dilution 1:4 Dilution 4000 Linear (1:1 Dilution) Linear (1:3 Dilution) Linear (1:4 Dilution) y = 0.7487x 3000 2 R = 0.995 Corrected Dilution Turbidity (NTRU) y = 0.6108x 2 R = 0.9644 2000 y = 0.6182x 2 R = 0.985 1000 0 0 1000 2000 3000 4000 5000 Whole Water Turbidity (NTRU) Effect of Dilutions X=Y
Effects of Particle Size on Turbidity Unregulated Streams, Larger particles DRAFT North Santiam Basin McKenzie Basin Regulated Streams, finer particles
Data Storage Problems • Data consistency / comparability issues • Comparability among instrument types remains largely unknown, especially in environmental applications • Almost always site / application specific • Need consistency within programs • Dilutions are not conservative • Want to be able to track instrument types
USGS/ASTMREPORTING UNITS US EPA 180.1 ISO 7027
Which Instrument Do I Use? • Based on Study Objectives • Decision Tree to help users decide which instrument type to use
Databases • USGS Database (QWDATA) • Parameter Codes corresponding to reporting units • Method codes specific to each instrument • Recent updates allow for 5 digit method codes • Can get help on m-code list within QWDATA • Spreadsheet available on NFM (Ch. 6.7) Web site http://water.usgs.gov/owq/FieldManual/Chapter6/6.7_contents.html
Database Issues • What is the appropriate level of reporting • What should be stored, rounded, & reported? • Low-Level Turbidity (e.g. < 10 FNU) • High-Level Turbidity (e.g. > 100 FNU) • Accuracy, Precision, Resolution, and Data Quality Objectives need to be considered • How do we make an old database learn these new tricks
Continuous Records Publication Status • ADAPS (& NWISWeb) have limitations • Resolution for shifting is same as for display / output • NWISWeb resolution is same as ADAPS (i.e. can’t “clean it up” for the web) • Turbidity scales are geared to factors of 4,000 TU (scratch formazin) but ADAPS is designed around multiples of 10 • No USGS-wide consensus on low level data • Some WSC’s use manufacturers specs (e.g. < 2) • Some WSC’s reporting data to 0.1 FNU with a disclaimer
Turbidity-- Considerations • Currently no federal regulations apply to natural waters • Turbidity isn’t an inherent physical property & is affected by many factors • Technological advances that account for these factors also reduce comparability • Techniques matter (static/dynamic, calibrants used)
Ongoing issues • New instruments continually being developed • Still have large variability within some categories • Databases • Education
Where to from here? • USGS National Field Manual Ch. 6.7 (http://water.usgs.gov/owq/FieldManual) • USGS historical data should be migrated to new pcodes, if instrument-specific information is available. • ASTM Round-Robin
Take Home Messages For surface waters, there is no such thing as “The Correct Turbidity”! Consistency, Consistency, Consistency! USGS reports and stores data with reporting units based on instrument type (Effective Oct. 1, 2004)
Questions? Chauncey Anderson503-251-3206chauncey@usgs.gov http://water.usgs.gov/owq/FieldManual