Download
1 / 13
130 likes | 163 Views
Explore the environmental challenges such as decreasing wine grape quality, increasing wildfires, and impacts on species due to global warming. Learn about greenhouse gas emissions, species vulnerability, and recommended websites for further information.

E N D
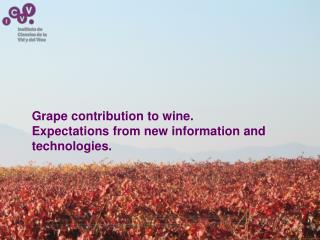
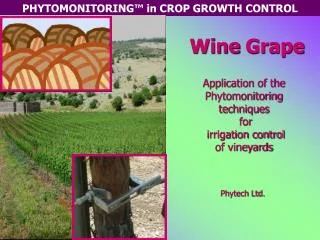
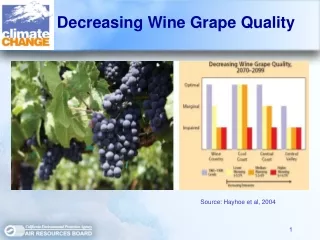
Decreasing Wine Grape Quality Source: Hayhoe et al, 2004
Decreasing Chill Hours Source: Baldocchi et al, 2005
Decreasing Dairy Production Source: Hayhoe et al. 2004
More Areas Favorable to Pests Projected Cotton Pink Bollworm Range Expansion Source: Gutierrez et al. 2006
Increasing Wildfires Data Source: Westerling and Bryant 2006
Impacts on Species • U.S. Department of Interior declared polar bears threatened species due to global warming (CNSNews.com Staff Writer, December 28, 2006) - declines in bear nutrition, birth weight and survival • California • Checkerspot Butterfly has been disappearing from the lower elevations and southern limits of its range. • Salmon are particularly vulnerable to climate change, warmer and drier climate could reduce their productivity by as much as 50 to 60%.
Governor’s Executive Orderand AB 32, Nunez/Pavley • GHG reduction targets • By 2010, reduce to 2000 levels* • By 2020, reduce to 1990 levels** (AB 32) • By 2050, 80% below 1990 levels*** * 60 MMT or 11% below business as usual ** 174 MMT or 30% below business as usual *** Where international scientists say we need to be
11 11 Size of the Challenge
California’s Anthropogenic GHG Emissions (2002) High Warming Gases (Hydrofluorocarbons, Perfluorocarbons, Sulfur Hexaflouride) 4% Nitrous Oxide 7% • Sources • Carbon Dioxide (CO2) • Fossil fuel combustion • Methane • Fossil fuels • Landfills, agriculture • Nitrous Oxide • Agriculture, cars • Hydrofluorocarbons • Refrigerants, solvents Methane 6%
Sources of California Emissions CO2 Equivalent (2002) Others 8% Transportation Electric Power 41% 20% Industrial 23% Agriculture & Forestry 8%
1 MMT CO2 is Equal To… • 216,000 cars not driven one year • 114 million gallons of gasoline saved • 2.3 million barrels of oil saved • Converting one 500 MW coal burning power plant to a 500 MW combined cycle gas plant • Replacing 1.5 million inefficient refrigerators • Replacing 13 million light bulbs with compact fluorescent lamps
Climate Change Species Indirect Greenhouse Gases Ozone precursors • Volatile Organic Compounds (VOC) • Oxides of Nitrogens (NOX) Carbon Monoxide (CO) Oxides of Sulfurs (SOX) Direct Greenhouse Gases • Carbon dioxide (CO2)* • Methane (CH4)* • Nitrous oxide (N2O)* • Hydrofluorocarbons (HFCs)* • Per fluorocarbons (PFCs) * • Sulfur hexafluoride (SF6) * • Ozone (O3) * Greenhouse gases identified in Kyoto protocol. Climate change impacts of other species are either too small or have highly uncertain warming/cooling impact. • Aerosols • Sulfate, Nitrate, Mineral Dust, Carbonaceous particles
Recommended WebsitesFor More Information • Intergovernmental Panel on Climate Change http://www.ipcc.ch/ • U.S Climate Change Science Program http://www.climatescience.gov/ • Goddard Institute for Space Studies – Institute on Climate and Planets: http://icp.giss.nasa.gov/ • California Climate Change Portal http://www.climatechange.ca.gov/index.html • ARB’s Climate Change Page http://www.arb.ca.gov/cc/cc.htm • U.S. EPA’s Global Warming Site http://yosemite.epa.gov/oar/globalwarming.nsf/content/index.html • Real Climate – Climate Science from Climate Scientists http://www.realclimate.org/