Download
1 / 25
250 likes | 402 Views
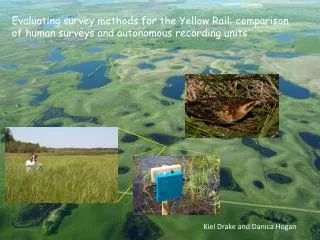
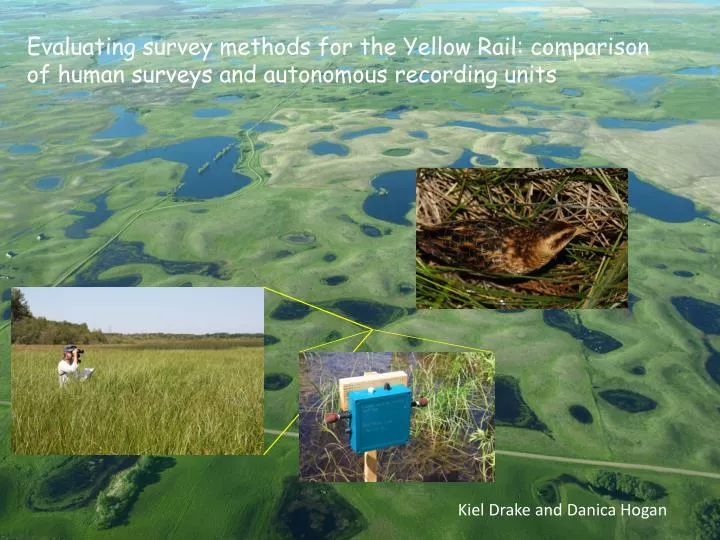
Evaluating survey methods for the Yellow Rail: comparison of human surveys and autonomous recording units. Kiel Drake and Danica Hogan. Background . Status of the Yellow Rail Federally listed as spp. of special concern in Canada E lusive species that is predominantly nocturnal

E N D
Evaluating survey methods for the Yellow Rail: comparison of human surveys and autonomous recording units Kiel Drakeand Danica Hogan
Background • Status of the Yellow Rail • Federally listed as spp. of special concern in Canada • Elusive species that is predominantly nocturnal • Occupies habitats that are not covered by roadside surveys (i.e. not well-sampled by existing monitoring programs) • Knowledge of breeding distribution, occurrence and abundance is incomplete
Surveys for Yellow Rails • Human Surveys • YERA occur in places that can be difficult to access • Survey efforts need to be nocturnal • Intensive survey protocol that employs call broadcast sampling and 2 visits to each station • Observers count individual calling males using auditory cues and determine (i.e., guess) distances to individuals • Autonomous Recording Units • ARUs: programmable, digital recorder that can enhance sampling opportunities • Studies show that listeners of recordings detect similar to greater numbers of spp.
Study Objectives Compare estimates of occupancy, abundance, and detection probabilities that emanate from human surveys and ARU recordings. Gain a better understanding of seasonal and diurnal variation in calling behaviour. ?
Methods: sampling • Human Surveys • Conducted point-count surveys 24 May-11 July between 22:00-03:00 hrs. (2011-2013) • 2-5 human surveys per station. • Standardized marsh bird monitoring protocol: 10-min survey, call-broadcast sampling, and minute-by-minute tracking of individuals. • Autonomous Recording Units • Programed to record for 5-min at the beginning of each hour between 18:00-09:00 hrs. • ARUs remained at each station for several days during deployment • Recordings were processed in a ‘lab’ setting
Methods: lab-based listening • Listeners used noise cancelling headphones, a spectrogram, and were permitted to pause/rewind during processing • Survey results entered directly into a database • YERA were counted using both aural cues and visual cues from the spectrogram
Methods: sample sizes and effort Survey stations 2011 (n = 40) 2012 (n = 49) 2013 (n = 44) Human Surveys 2011 (n = 199) 2012 (n = 171) 2013 (n = 88) ARU Surveys 2011 (n = 400) 2012 (n = 490) 2013 (n = 440)
Study Objectives Compare estimates of occupancy, abundance, and detection probabilities that emanate from human surveys and processing of recordings. Gain a better understanding of seasonal and diurnal variaiton in calling behaviour. ?
Objective 1: analysis • N-mixture models in the R package ‘unmarked’ • Fits hierarchical models of wildlife occurrence and abundance • Requires a repeated-measures type of sampling design; spatial sampling is an explicit component of the problem. • Accommodates counts of individuals that may not be uniquely recognized • ‘Unmarked’ provides a unified framework for analysis recognizing that observations are generated by a combination of (1) a state process determining abundance/occupancy and (2) a detection process that yields observations conditional on the state process.
Discussion • ARUs have a smaller overall sampling radius due to internal microphone noise. • ARUs are probably more consistent (among units) at ‘hearing’ than people are at hearing and determining distance to calling birds. • What is the area being surveyed by ARUs when the target species is Yellow Rail?
Study Objectives Compare estimates of occupancy, abundance, and detection probabilities that emanate from human surveys and processing of recordings. Gain a better understanding of seasonal and diurnal variation in calling behaviour. ?
Objective #2 Results: diurnal variation ARU data 2011-2013 n 6,100
Objective #2 Results: seasonal variation ARU data 2011-2013 22:00-03:00 hrs n 3,081
Study Objectives • Compare estimates of occupancy, abundance, and detection probabilities that emanate from human surveys and processing of recordings. • ARUs provide more precise estimates of abundance and are likely more consistent in the area that is surveyed. • 2. Gain a better understanding of seasonal and diurnal phenology of calling behaviour. • Highest rate of detection occurred between 23:00-0300hrs and approximately May 23- June 30.
Partners & Sponsors • Environment Canada/Canadian Wildlife Service • Saskatchewan Fish &Wildlife Development Fund • Saskatchewan Water Security Agency • Service Canada HRDC • Science Horizons • Wildlife Habitat Canada