Download
1 / 34
350 likes | 536 Views
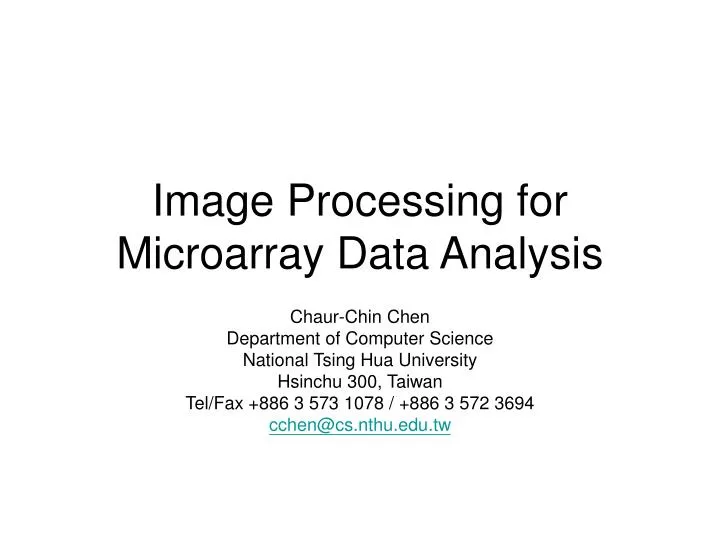
Image Processing for Microarray Data Analysis. Chaur-Chin Chen Department of Computer Science National Tsing Hua University Hsinchu 300, Taiwan Tel/Fax +886 3 573 1078 / +886 3 572 3694 cchen@cs.nthu.edu.tw. Outline. A Digital Image Processing System Image Representation and Formats

E N D
Image Processing for Microarray Data Analysis Chaur-Chin Chen Department of Computer Science National Tsing Hua University Hsinchu 300, Taiwan Tel/Fax +886 3 573 1078 / +886 3 572 3694 cchen@cs.nthu.edu.tw
Outline • A Digital Image Processing System • Image Representation and Formats 1. Sensing, Sampling, Quantization 2. Gray level and Color Images 3. Raw, RGB, Tiff, BMP, JPG, GIF, (JP2) • Image Transform and Filtering • Histogram, Enhancement and Restoration • Segmentation, Edge Detection, Thinning • Image Data Compression • Pattern Recognition (Supervised Learning) • Clustering Algorithms (Unsupervised Learning) • Microarray Image Pattern Analysis R.C. Gonzalez and R.E. Woods, Digital Image Processing, Prentice-Hall, 2002 D. Stekel, Microarray Bioinformatics, Cambridge University Press, 2003
Digital Image Analysis System • A 2D image is nothing but a mapping from a region to a matrix • A Digital Image Processing System consists of 1. Acquisition – scanners, digital camera, ultrasound, X-ray, MRI, PMT 2. Storage – HD, CD (700MB), DVD (4.7GB), HD-DVD (20GB), Flash memory (256 MB +) 3. Processing Unit – PC, Workstation, PC-cluster 4. Communication – telephone, cable, wireless 5. Analysis – Software such as Genepix Pro, Array Pro Analyzer, Agilent, Matlab, BioNumerics, Melani-3 6. Display – LCD monitor, laser printer, laser-jet printer
Gray and Color Image Data • 0, 64, 144, 196, 225, 169, 100, 36 (R, G, B) for a color pixel Red – (255, 0, 0) Green – ( 0, 255, 0) Blue – ( 0, 0, 255) Cyan – ( 0,255, 255) Magenta – (255, 0, 255) Yellow – (255, 255, 0) Gray – (128, 128, 128)
Image Representation (Gray/Color) • A gray level image is usually represented by an M by N matrix whose elements are all integers in {0,1, …, 255} corresponding to brightness scales • A color image is usually represented by 3 M x N matrices whose elements are all integers in {0,1, …, 255} corresponding to 3 primary primitives of colors such as Red, Green, Blue
Sensing, Sampling, Quantization • A 2D digital image is formed by a sensor which maps a region to a matrix • Digitization of the spatial coordinates (x,y) in an image function f(x,y) is called Sampling • Digitization of the amplitude of an image function f(x,y) is called Quantization
The American National Standards Institute (ANSI) sets standards for voluntary use in US. One of the most popular computer standards set by ANSI is the American Standard Code for Information Interchange (ASCII) which guarantees all computers can exchange text in ASCII format BMP – Bitmap format from Microsoft uses Raster-based 1~24-bit colors (RGB) without compression or allows a run-length compression for 1~8-bit color depths GIF – Graphics Interchange Format from CompuServe Inc. is Raster-based which uses 1~8-bit colors with resolutions up to 64,000*64,000 LZW (Lempel-Ziv-Welch, 1984) lossless compression with the compression ratio up to 2:1 Image File Formats (1/2)
Image File Formats (2/2) • Raw – Raw image format uses a 8-bit unsigned character to store a pixel value of 0~255 for a Raster-scanned gray image without compression. An R by C raw image occupies R*C bytes or 8RC bits of storage space • TIFF – Tagged Image File Format from Aldus and Microsoft was designed for importing image into desktop publishing programs and quickly became accepted by a variety of software developers as a standard. Its built-in flexibility is both a blessing and a curse, because it can be customized in a variety of ways to fit a programmer’s needs. However, the flexibility of the format resulted in many versions of TIFF, some of which are so different that they are incompatible with each other • JPEG – Joint Photographic Experts Group format is the most popular lossy method of compression, and the current standard whose file name ends with “.jpg” which allows Raster-based 8-bit grayscale or 24-bit color images with the compression ratio more than 16:1 and preserves the fidelity of the reconstructed image • EPS – Encapsulated PostScript language format from Adulus Systems uses Metafile of 1~24-bit colors with compression • JPEG 2000
Image Transforms and Filtering • Feature Extraction – find all ellipses in an image • Bandwidth Reduction – eliminate the low contrast “coefficients” • Data Reduction – eliminate insignificant coefficients of Discrete Cosine Transform (DCT), Wavelet Transform (WT) • Smooth filtering can get rid of noisy signals
Discrete Cosine Transform (DCT) X: a block of 8x8 pixels A=Q8: 8x8 DCT matrix as shown above Y=AXAt
Daubechies’ 4 Wavelet Transform • X: an image • W: Haar transform shown above with ci = 1/√2 • Y=P*W*(X*Wt*Q), where • P and Q are permutation matrices
X1 X2 X3 X4 X0 X5 X6 X7 X8 Replace the X0 by the mean of X0~X8 is called “mean filtering” X1 X2 X3 X4 X0 X5 X6 X7 X8 Replace the X0 by the median of X0~X8 is called “median filtering” Mean andMedian Filtering
Enhancement and Restoration • The goal of enhancementis to accentuate certain features for subsequent analysis or image display. The enhancement process is usually done interactively • The restoration is a process that attempts to reconstruct or recover an image that has been degraded by using some unknown phenomenon
Segmentation and Edge Detection • Segmentation is basically a process of pixel classification: the picture is segmented into subsets by assigning the individual pixels into classes • Edge Detection is to find the pixels whose gray values or colors being abruptly changed
Edge Detection -1 -2 -1 0 0 0 X 1 2 1 -1 0 1 -2 0 2 Y -1 0 1 Large (|X|+|Y|) Edge
Thinning and Contour Tracing • Thinning is to find the skeleton of an image which was commonly used for Optical Character Recognition (OCR) and Fingerprint matching • Contour tracing is usually used to locate the boundaries of an image which can be used in feature extraction for shape discrimination
Image Data Compression • The purpose is to save storage space and to reduce the transmission time of information. Note that it requires 6 mega bits to store a 24-bit color image of size 512 by 512. It takes 6 seconds to download such an image via an ADSL (Asymmetric Digital Subscriber Line) with the rate 1 mega bits per second and more than 12 seconds to upload the same image • Note that 1 byte = 8 bits, 3 bytes = 24 bits
Thank you • KoalaAngel wishes you have wonderful holidays • I am from Brisbane, Australia and sleep 16 hours each day but you should not • August 12, 2004