Download
1 / 24
240 likes | 373 Views
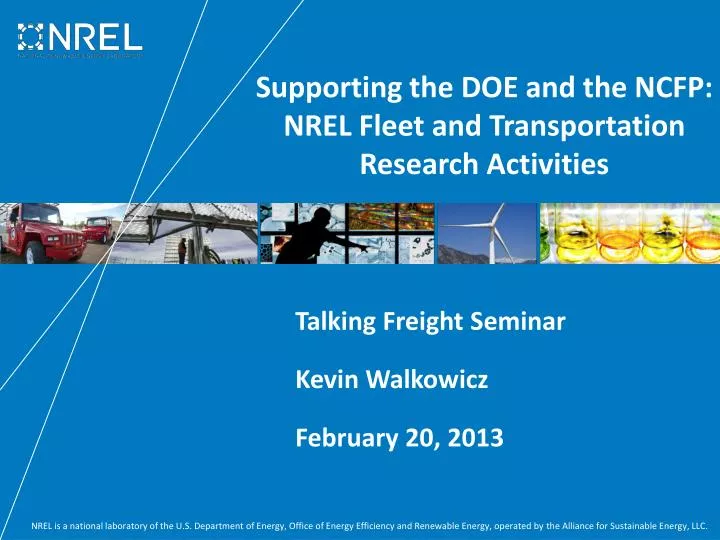
Supporting the DOE and the NCFP: NREL Fleet and Transportation Research Activities . Talking Freight Seminar Kevin Walkowicz February 20, 2013. NCFP Supporting Activities: Resources Available to NCFP. MD & HD Field Testing and Evaluation Efforts Electric Hybrid Hydraulic Hybrid

E N D
Supporting the DOE and the NCFP: NREL Fleet and Transportation Research Activities Talking Freight Seminar Kevin Walkowicz February 20, 2013
NCFP Supporting Activities: Resources Available to NCFP • MD & HD Field Testing and Evaluation Efforts • Electric Hybrid • Hydraulic Hybrid • Battery Life • Electric Vehicle Deployment • MD & HD Data Collection and Analysis • Recovery Act Data Analysis • Smith, Navistar: EV Delivery Trucks • Cascade Sierra: Truckstop Electrification • Tools and Data • Fleet DNA • DRIVE • FASTSim
MD Field Testing & Evaluation Example: UPS HEV Gen II • Project Background & Accomplishment: On-road evaluation of Eaton’s latest next-generation hybrid electric system in package delivery application at UPS. Final report in May 2012. • Data collected – 18 months of operation: • Fuel economy and maintenance records • Engine control unit (ECU) records downloaded regularly • Miles traveled • Fuel consumed • Percent idle time • DPF regenerations • GPS route data logging • ReFUEL dynamometer testing • Details: • Minneapolis location • Eleven 2010 hybrid vans (2007 emissions) • Eleven 2010 conventional vans (2007 emissions)
Laboratory Test Cycle Selection: Understanding Usage Routes in same location show driving variability • r
HEV Dyno Testing: Realistic Cycles in a Controlled Setting • Laboratory Chassis Dynamometer: Route Variability Translates to MPG Variability • In the laboratory, hybrids demonstrated a statistically significant 21% to 45%improvement in ton-mi./gal fuel economy, 13% to 36% on an mpg basis
FedEx HEV Field Test Example: LA Delivery Vans + Ontario Box Trucks • Ontario, CA HEV Box Truck vs conventional 2010 diesel • Completion in March 2013 • Dyno data only available now • Los Angeles, CA Gasoline HEV vs conventional diesel delivery van – completion in Dec. 2010 • Complete report available
Gasoline HEV Van: Chassis Dyno + Field Data Slight hybrid advantage on one cycle in laboratory..
Field Testing & Evaluation Example: Hydraulic Hybrid • 20 Parker HHV’s –vs- 20 conventional diesels in Baltimore and/or Atlanta • HHV’s and Conventional will run on similar routes to avoid a route switch among vehicles to make a fair comparison Data: • Fuel economy and maintenance records on all vehicles – 12 months • Engine ECU “image” data (taken monthly) • Dynamometer testing: test cycles chosen to match proposed GPS study results • Monthly Analysis: • Service Records • Warranty • Driver Fueling Logs • Vehicle Downtime / Availability • Road Calls Starts in March 2013
Field Testing & Evaluation Example: EV Deployment • Frito Lay EV’s Study • Case study’ of EV deployments (Smith vehicles) at two Frito Lay distribution centers • Study will compare EV’s versus 2010 diesel operation • Will focus on: • Installation experience • Overall costs (conventional vs. EV) • Battery degradation & range: test batteries on-site to determine rate of degradation vs. usage • Use patterns: Drive cycle &intelligent deployment • V2B opportunities (demand charge reductions) • Grid Integration Study? Show effects of plugging in larger numbers of vehicles at one location at same time.
NCFP Interests: Battery Life Prediction • Life model developed based on laboratory test data for many duty-cycles and temperature conditions • Model is extensible to other duty-cycles, but requires field validation to understand variables Battery Life Model Simulation Studies PHEV40, Phoenix 782 drv cycles
Recovery Act Data Analysis • ARRA funds helped deploy vehicles and EVSEs, some of which were MD/HD focused: • Smith Electric Vehicles - Newton (500 vehicles) • Navistar - eStar (up to 950 vehicles) • South Coast Air Quality Management District / EPRI – Utility bucket trucks and class 3 service vans (~350 vehicles) • Cascade Sierra Solutions - sleeper cab trucks and electrified truckstops (50 sites and 5000 trucks) • DOE Program collecting and analyzing data to understand usage, barriers and challenges • ~30 channels of 1hz data collected and stored at NREL • ~30 distinct data analysis products produced as data received • Quarterly reports published on basic usage statistics – similar to INL format on LD EV’s • Quarterly and cumulative summary results are available on the Fleet Test and Evaluation subsite, • http://www.nrel.gov/vehiclesandfuels/fleettest/
Smith Electric Vehicle – ARRA Data Analysis • 500 Newtons being deployed in U.S. • Manufactured in Kansas City, MO • $32 Million ARRA award • 100 mile electric range required (cycle dependent) • Deployment plans included 20 launch partners including: • Frito-Lay • Coca Cola (NY) • Kansas City Power and Light (MO) • AT&T (MO) • Staples (CA, OH) • PG&E (CA) • FedEx
Cascade Sierra: Truckstop Electrification Analysis • 50 TSE sites with Shorepower Technologies • Idle reduction technologies rebated (5000) • Auxiliary power units/ generator sets • Battery air conditioning systems • Thermal storage systems, evaporative coolers • Trailer transport refrigeration units • Straight truck cold plate and refrigeration systems • Plug-in adapter kits. • Data collected will include: • # of plug in events • Total kWh used • Fuel Saved • GHG avoided • Time of day, length of use, etc • Data Reporting to Start in March 2013
Tools for Fleets: Fleet DNA Online vocational database of vehicle-use information Phase 1: Presorted Data Sets • Phase 2: Sortable Data Sets • Users can custom sort and graph: • Class • Vocation • Fuel type (or drivetrain) • Region (4) • Sub-region (based on census map)
Fleet DNA Benefits • OEMs • Better understanding of customer-use profiles • Fleets • Determine maximum ROI from investment • Funding agencies • Optimize impact of financial incentive offers • Researchers • Data source for modeling and simulation • Fleet DNA features: • Aggregated and anonymous data • Fleets are not identified • 20-plus high-value metrics • Data products for each vocation • Data for industry drive-cycle development
Fleet DNA Data Sets • Class 4-6 Delivery Vans Parcel, food, uniform • Class 3-4 Light Aerials Telecom service • Class 5-6 AerialUtilities • Class 3 Service VansTelecom • Class 8 Tractor Trailers Beverage delivery • Class 6 Box Trucks In-city delivery • EV MD Delivery Vans Multiple uses • Class 8 OTR Tractor Trailers • Transit Buses • Shuttle Buses Airport, specialty • Refuse Trucks Multiple types • Tow Trucks • Class 8 OTR Tractor Trailers • Transit Buses • Shuttle Buses • Refuse Trucks • Tow Trucks • High PTO Use Work Trucks • DOE’s Data Priorities: • National fuel consumption • Payback/ROI success • Scalable or transferable technology
Tools for Fleets -Data Analysis: DRIVETM • Helps fleets, OEMs understand vehicle use • For proper placement, design, and testing • Combines large amounts of user data • Filters/creates new cycles • Quickly processes/analyzes data • Integrates with Fleet DNA for public use
Tools for Fleets - Data Analysis: Simulation • FASTSim • Vehicle modeling tool • Well suited for large data sweeps • Short run time in accessible Excel environment • Validated performance outputs • Fuel economy • Cost results
Verizon & DOE NCFP Goal: Calculated Decision Making Using Data Capabilities to Support the NCFP Fleets: Fleet Analysis - Verizon Example “Quick” Assessment of Fleet to Identify Best Technology for Application Capture key operational data from 40 “light aerial boom trucks” and service vans operating in three locations within Verizon fleet Provide analysis & produce key metrics from acquired data to allow Verizon to develop strategic procurement / deployment plans within Verizon fleet Provide recommendation for appropriate drive cycles for analysis and testing of advanced technologies Use data and FASTSim to simulate advanced technologies across observed drive cycles NREL PIX 06118 Analysis of Data Drive Cycle Recommendation / Smart Deployment Captured Vehicle Data
Thank you! Kevin Walkowicz Fleet Testing and Evaluation Team Lead National Renewable Energy Laboratory Golden, Colorado kevin.walkowicz@nrel.gov