Download
1 / 7
70 likes | 72 Views
<br><br>Sucker rod coupling friction values are used by rod design software to calculate rod loads for bare steel tubing on steel couplings. Visit: https://westernfalcon.com<br>

E N D
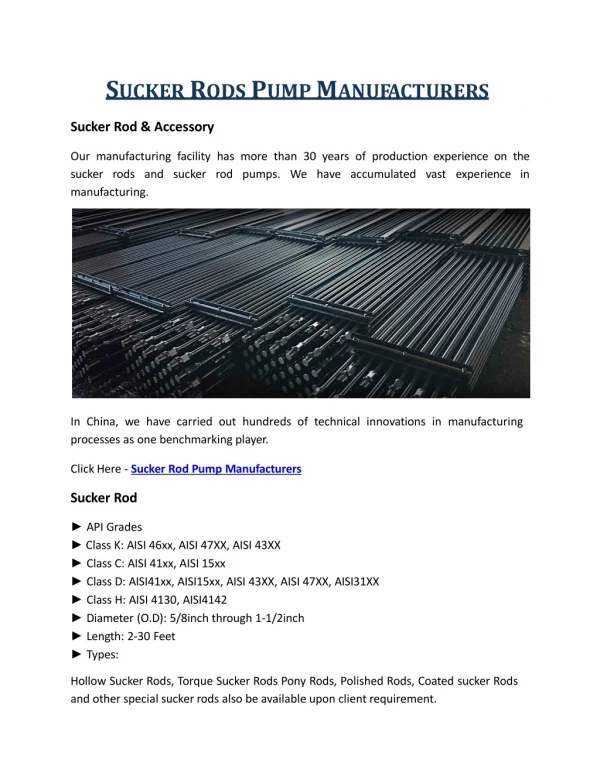
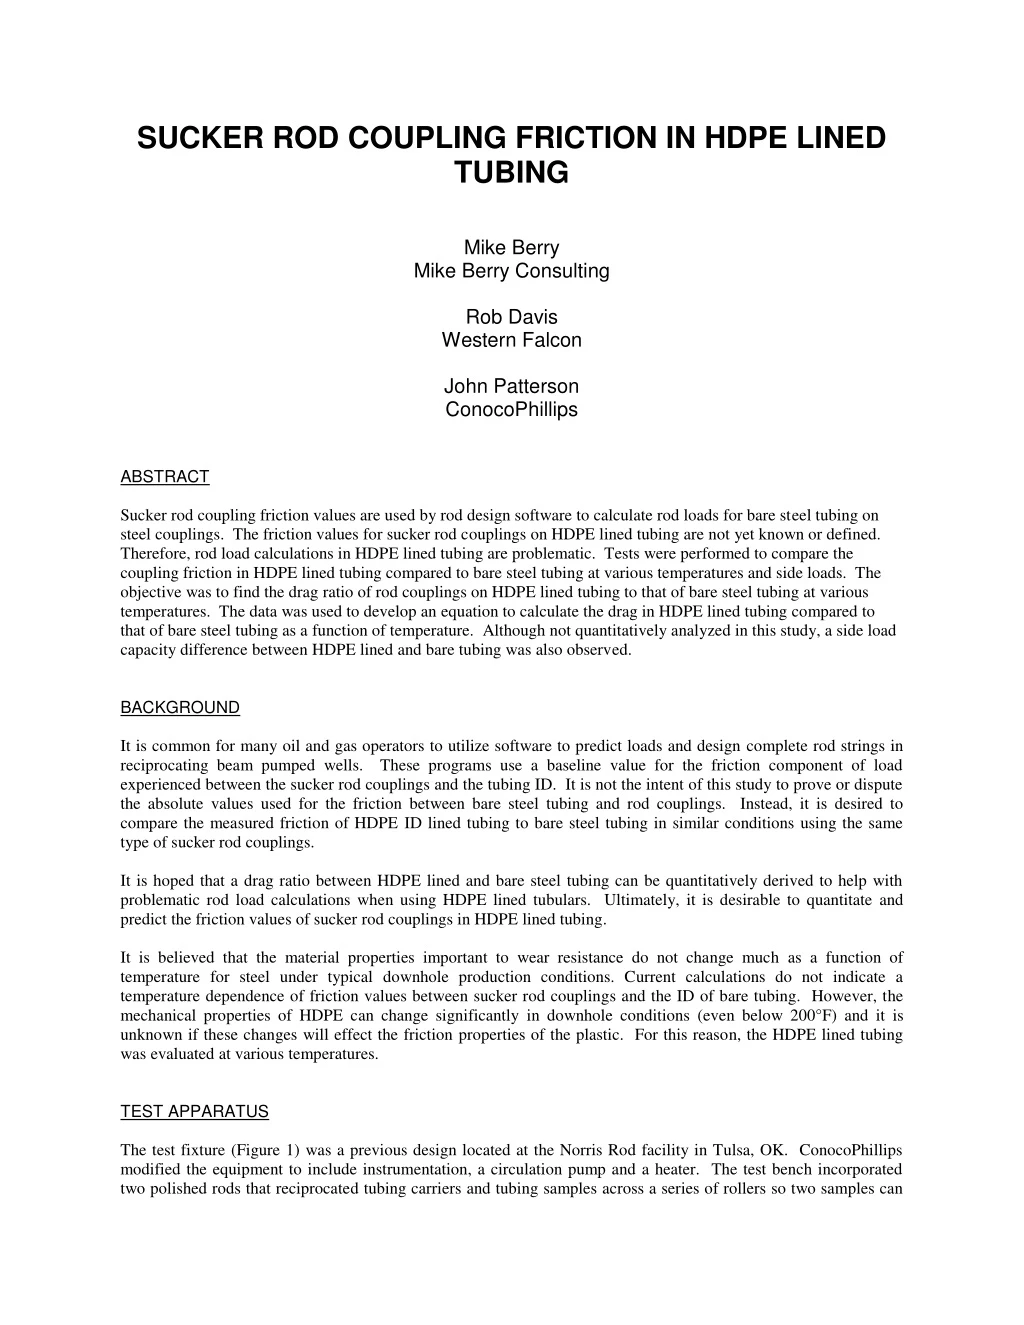
SUCKER ROD COUPLING FRICTION IN HDPE LINED TUBING Mike Berry Mike Berry Consulting Rob Davis Western Falcon John Patterson ConocoPhillips ABSTRACT Sucker rod coupling friction values are used by rod design software to calculate rod loads for bare steel tubing on steel couplings. The friction values for sucker rod couplings on HDPE lined tubing are not yet known or defined. Therefore, rod load calculations in HDPE lined tubing are problematic. Tests were performed to compare the coupling friction in HDPE lined tubing compared to bare steel tubing at various temperatures and side loads. The objective was to find the drag ratio of rod couplings on HDPE lined tubing to that of bare steel tubing at various temperatures. The data was used to develop an equation to calculate the drag in HDPE lined tubing compared to that of bare steel tubing as a function of temperature. Although not quantitatively analyzed in this study, a side load capacity difference between HDPE lined and bare tubing was also observed. BACKGROUND It is common for many oil and gas operators to utilize software to predict loads and design complete rod strings in reciprocating beam pumped wells. These programs use a baseline value for the friction component of load experienced between the sucker rod couplings and the tubing ID. It is not the intent of this study to prove or dispute the absolute values used for the friction between bare steel tubing and rod couplings. Instead, it is desired to compare the measured friction of HDPE ID lined tubing to bare steel tubing in similar conditions using the same type of sucker rod couplings. It is hoped that a drag ratio between HDPE lined and bare steel tubing can be quantitatively derived to help with problematic rod load calculations when using HDPE lined tubulars. Ultimately, it is desirable to quantitate and predict the friction values of sucker rod couplings in HDPE lined tubing. It is believed that the material properties important to wear resistance do not change much as a function of temperature for steel under typical downhole production conditions. Current calculations do not indicate a temperature dependence of friction values between sucker rod couplings and the ID of bare tubing. However, the mechanical properties of HDPE can change significantly in downhole conditions (even below 200°F) and it is unknown if these changes will effect the friction properties of the plastic. For this reason, the HDPE lined tubing was evaluated at various temperatures. TEST APPARATUS The test fixture (Figure 1) was a previous design located at the Norris Rod facility in Tulsa, OK. ConocoPhillips modified the equipment to include instrumentation, a circulation pump and a heater. The test bench incorporated two polished rods that reciprocated tubing carriers and tubing samples across a series of rollers so two samples can
be tested simultaneously in the fixture (Figure 2). The tubing carriers were immersed in water during the test. Sucker rod couplings were held against the tubing ID with various weights (ranging from 20 to 170 pounds of side load) to simulate different side loads as the tubing reciprocated back and forth in the carriers (Figure 4). In order to contain the fluid in the test area, the polished rods pass through “stuffing boxes” on the end of the fluid chamber. Load cells were installed between the reciprocating drive mechanism and the end of the polished rods (Figure 3). The load cells are capable of operating in both compression and tension. Although this apparatus utilizes moving tubing and relatively stationary sucker rod couplings (opposite of typical well conditions), it duplicates the acceleration and deceleration of the reciprocating motion of rod strings in beam pumped wells. Safety procedures dictated that only water could be used in the test chamber. It is believed that exposure to even small amounts of liquid hydrocarbons enhances the lubricity of the HDPE liners. As many rod pumped wells contain liquid hydrocarbons, the HDPE lined samples were soaked in kerosene overnight prior to testing. TEST PROCEDURE The test matrix was designed to evaluate several variables including side loads, temperature effects on the thermoplastic liner material, and the presence/absence of a HDPE liner in the tubing as they alter the friction of steel sucker rod boxes on the tubing ID. The load cells were calibrated in compression prior to running any tests. In order to minimize any differences of geometry in the tubing ID versus the rod boxes, bare 2 3/8-inch (nominal ID of 1.995-inch) tubing samples and HDPE lined 2 7/8-inch (nominal ID with liner of 2.16-inch) were compared and used in all tests. At every new temperature for the lined samples, a new tubing sample was used. Prior to collecting any data, a “break-in” run was allowed to establish a “nominal” wear surface on all samples. Also, new sucker rod boxes were used for every new sample. The data was collected using a Monarch DC1250 data logger. Samples were taken at an interval of every 0.05 seconds. The test fixture operated at approximately 12 strokes per minute; therefore, approximately 102 data points were taken during every complete stroke. Initially, a run was conducted without any sucker rod box load on the tubing samples in the carriage to determine the base load of the apparatus (primarily from the rollers under the tubing sample carriage and stuffing box). (Figures. 5-8) Then the steel samples were run at room temperature to establish the baseline friction value of the sucker rods on bare steel tubing (Figures 9-12). The HDPE lined samples were evaluated at various temperatures ranging from 87°F to 170°F (Figures 13-16). NOTE: Although the tests did not show a reduction in performance above 160°F, Western Falcon does not recommend using HDPE lined tubing in oil producing wells above 160°F. In higher temperature wells, plastics rated to perform in hotter environments are required. DATA FILTERING AND ANALYSIS The initial review of the data indicated a fair amount of noise in the data. It is believed that the noise was from several factors including the high sample rate, dynamic nature of the test and sensitivity of the load cells. In an effort to eliminate the obvious noise, hi/low filters were utilized and the data was smoothed with a three element running average. Finally to create a “composite” stroke pattern for each data set, twelve strokes worth of smoothed data were overlaid. The data was not symmetrical in the “up stroke” (tension) and “down stroke” (compression) directions. It is believed that this was because the load cells were only calibrated in the compression direction and not calibrated in the tension direction. Also, one of the test channels (two samples were fitted in the apparatus simultaneously), Channel A, did not produce consistent results. For these reasons, the data analysis was all based on the “down stroke” (compression) data from Channel B.
Since the drag was measured outside of the stuffing box and inside the test carriage, the drag from both the stuffing box and the roller drag on the test carriage were subtracted from the data to get the actual drag of the sucker rod couplings on the tubing ID. TEST SUMMARY Drag measurements were made at the “top” of the polished rod. These measurements are shown in Figure 17. Side load friction should be zero with a zero side load. However, there was a “stuffing box” between the load cells and the test samples. This friction is assumed to be a constant at a given temperature and can be subtracted out of the measurements by subtracting the zero side load friction from the measured values. This has been done in Figure 18. The values shown in Figure 18 are the coupling friction plus the roller friction. Note roller friction includes the fluid resistance of the tubing sample carriages moving in the fluid bath. If we subtract the roller friction from these values we are left with the coupling friction. This is shown if Figure 19. The data yields a distinct pattern for the coupling drag with respect to the temperature differences in the lined tubing and a significant difference between the lined tubing and bare steel tubing with one exception. The first tested lined sample, evaluated at the lowest temperature of 87°F, does behave like all of the other temperature data. The reasons for this are fully understood. Because of this, the 87°F data was excluded from the final relationship so the range of validity of this relationship is limited to 97-170°F. We can now divide the lined tubing coupling friction values by the corresponding bare steel tubing drag to obtain the drag ratio between bare and lined tubing at the various test temperatures. This is shown in Figure 20. The data set now shows a constant drag ratio at each tested temperature. These drag ratios range from 0.50 to 0.65 over the temperature range of 98°F to 170°F. These values can now be plotted as a function of temperature as shown in Figure 21. From this we derive a correlation for the drag ratio of HDPE lined to bare steel tubing over the temperature range of 98°F to 170°F. The relationships are: DRHDPE/Steel = 0.002 x T + 0.32, where T is the temperature in degrees F. DHDPE = DSteel x DRHDPE/Steel NOTE: A few reservations should be noted concerning this relationship. As previously mentioned, the data required filtering to eliminate noise. The data taken on the HDPE liner at 87°F did not fall in line with the data (measured load versus side load) from other temperatures which were all parallel. It was also discovered that the drag component produced by the stuffing box was temperature dependent. There is also some question if the drag component of the carriage/rollers and the steel are also temperature dependent. CONCLUSIONS It was observed that sucker rod coupling friction in HDPE lined tubing is less than in bare steel tubing. The steel was significantly compromised by increasing side loads and the HDPE liner was much more resilient and handled the higher side loads better indicating that the HDPE liner has a higher side load capacity than bare steel tubing. This initial data set yielded consistently linear results; however, additional roller friction testing is recommended to refine the HDPE/Steel drag ratio equation.
ACKNOWLEDGEMENTS The authors are greatly appreciative of the following contributors: John Patterson and ConocoPhillips for providing the test concept and funding Mike Berry for turning the test concept into a viable reality with usable data Chris Rust and Norris Rods for providing the test fixture, rods and couplings Rob Davis and Western Falcon for providing the bare and HDPE lined tubing Tom Ellis and Western Falcon for assisting with the testing Figure 2 - Installed Test Samples Figure 1 - Test Fixture Figure 4 - Test Fixture in Operation Figure 3 - Installed Load Cells
Roller Friction, 75 °F, 150 lb Sideload Roller Friction, 75 °F, 150 lb Sideload 3 Element Running Average Filtered Values Unfiltered Values 9:11:48.48 9:11:57.12 9:12:05.76 9:12:14.40 9:12:23.04 9:12:31.68 9:12:40.32 9:12:48.96 9:12:57.60 9:11:48.48 9:11:57.12 9:12:05.76 9:12:14.40 9:12:23.04 9:12:31.68 9:12:40.32 9:12:48.96 9:12:57.60 100 200 100 50 0 0 Drag (lb) -100 Drag (lb) -50 -200 -100 -300 -150 -400 -200 -500 A Run. Avg. Filt. Drag (lbs) B Run. Avg. Filt. Drag (lbs) A Unfilt. Drag (lbs) B Unfilt. Drag (lbs) LoFilt HiFilt Figure 6 - Average Roller Friction Data Figure 5 - Raw Roller Friction Data Roller Drag (75 °F) Roller Friction, 75 °F, 150 lb Sideload Composite Values 60 y = 0.1329x + 24.699 R2 = 0.9838 100 40 20 y = 0.2692x - 7.1194 R2 = 0.9949 50 0 -20 Drag (lbs) 0 -40 Drag (lb) -60 -50 -80 y = -0.255x - 73.385 R2 = 0.93 -100 -100 y = -0.1485x - 96.064 R2 = 0.4883 -120 -150 -140 0 20 40 60 80 100 120 140 160 Load (lbs) -200 A Comp. Filt. Drag (lbs) A Up Str. Avg. Comp. Filt. Drag (lbs) B Comp. Filt. Drag (lbs) B Dn. Str. Avg. Comp. Filt. Drag (lbs) A Dn. Str. Avg. Comp. Filt. Drag (lbs) B Up Str. Avg. Comp. Filt. Drag (lbs) A Pos. Drag (lbs) Linear (A Pos. Drag (lbs)) B Pos. Drag (lbs) Linear (B Pos. Drag (lbs)) A Neg. Drag (lbs) Linear (A Neg. Drag (lbs)) B Neg. Drag (lbs) Linear (B Neg. Drag (lbs)) Figure 8 - Roller Friction Relationships Figure 7 - Composite Roller Friction Data Bare Steel, 2 Cplgs, 89 °F, 93 lb Sideload Unfiltered Values Bare Steel, 2 Cplgs, 89 °F, 93 lb Sideload 3 Element Running Average Values 14:25:00.48 14:25:09.12 14:25:17.76 14:25:26.40 14:25:35.04 14:25:43.68 14:25:52.32 14:26:00.96 14:26:09.60 14:25:00.48 14:25:09.12 14:25:17.76 14:25:26.40 14:25:35.04 14:25:43.68 14:25:52.32 14:26:00.96 14:26:09.60 300 500 400 200 300 200 100 100 Drag (lb) Drag (lb) 0 0 -100 -100 -200 -300 -200 -400 -500 -300 A Unfilt. Drag (lbs) B Unfilt. Drag (lbs) LoFilt HiFilt A Run. Avg. Drag (lbs) B Run. Avg. Drag (lbs) Figure 10 - Average Bare Tubing Friction Data Figure 9 - Raw Bare Tubing Friction Data
Bare Steel, 2 Cplgs, 89 °F, 93 lb Sideload Bare Steel, 2 Cplgs (85 °F) Load (lbs) 200 0 20 40 60 80 100 120 140 160 150 300 100 200 50 y = 0.9588x + 38.302 R2 = 0.9788 100 y = 1.0776x + 30.185 R2 = 0.7801 0 Drag (lb) Drag (lbs) 0 -50 -100 -100 y = -1.1141x - 70.121 R2 = 0.9777 -150 y = -1.5361x - 60.983 R2 = 0.9128 -200 -200 -300 -250 -400 -300 A Pos. Drag (lbs) Linear (A Pos. Drag (lbs)) B Pos. Drag (lbs) Linear (B Pos. Drag (lbs)) A Neg. Drag (lbs) Linear (A Neg. Drag (lbs)) B Neg. Drag (lbs) Linear (B Neg. Drag (lbs)) A Comp. Filt. Drag (lbs) A Up Str. Avg. Comp. Filt. Drag (lbs) B Comp. Filt. Drag (lbs) B Dn. Str. Avg. Comp. Filt. Drag (lbs) A Dn. Str. Avg. Comp. Filt. Drag (lbs) B Up Str. Avg. Comp. Filt. Drag (lbs) Figure 12 - Bare Tubing Friction Relationships Figure 11 - Composite Bare Tubing Friction Data Poly Lined, 2 Cplgs, 125 °F, 0 lb Sideload Unfiltered Values Poly Lined, 2 Cplgs, 125 °F, 0 lb Sideload 3 Element Running Average Values 9:32:41.28 9:32:49.92 9:32:58.56 9:33:07.20 9:33:15.84 9:33:24.48 9:33:33.12 9:33:41.76 9:33:50.40 9:33:59.04 9:32:41.28 9:32:49.92 9:32:58.56 9:33:07.20 9:33:15.84 9:33:24.48 9:33:33.12 9:33:41.76 9:33:50.40 9:33:59.04 100 150 100 50 50 0 0 Drag (lb) Drag (lb) -50 -50 -100 -100 -150 -200 -150 A Unfilt. Drag (lbs) B Unfilt. Drag (lbs) LoFilt HiFilt A Run. Avg. Drag (lbs) B Run. Avg. Drag (lbs) Figure 14 - Typical Avg. Lined Tubing Friction Data Figure 13 - Typical Raw Lined Tubing Friction Data Poly Lined, 2 Cplgs, 125 °F, 0 lb Sideload Poly Liner, 2 Cplgs (125 °F) 200 100 150 y = 0.5533x + 47.001 R2 = 0.9255 100 50 y = 0.7042x + 8.9355 R2 = 0.9663 50 Drag (lbs) 0 0 Drag (lb) -50 -100 y = -0.6342x - 70.729 R2 = 0.9446 -50 -150 y = -0.7619x - 100.48 R2 = 0.8632 -200 -100 -250 0 20 40 60 80 100 120 140 160 180 Load (lbs) -150 A Comp. Filt. Drag (lbs) A Up Str. Avg. Comp. Filt. Drag (lbs) B Comp. Filt. Drag (lbs) B Dn. Str. Avg. Comp. Filt. Drag (lbs) A Dn. Str. Avg. Comp. Filt. Drag (lbs) B Up Str. Avg. Comp. Filt. Drag (lbs) A Pos. Drag (lbs) Linear (A Pos. Drag (lbs)) B Pos. Drag (lbs) Linear (B Pos. Drag (lbs)) A Neg. Drag (lbs) Linear (A Neg. Drag (lbs)) B Neg. Drag (lbs) Linear (B Neg. Drag (lbs)) Figure 15 – Typical Composite Lined Tbg. Friction Data Figure 16 - Typical Lined Tubing Friction Relationships
Polished Rod Drag Channel B "Down Stroke" Roller Drag Channel B "Down Stroke" (Forced Zero Intercept) 160 200 140 180 Roller 75°F Dn. Str. Steel 84°F Dn. Str. Poly 87°F Dn. Str. Poly 98°F Dn. Str. Poly 125°F Dn. Str. Poly 150°F Dn. Str. Poly 170°F Dn. Str. Linear (Steel 84°F Dn. Str.) Linear (Poly 87°F Dn. Str.) Linear (Poly 98°F Dn. Str.) Linear (Poly 125°F Dn. Str.) Linear (Poly 150°F Dn. Str.) Linear (Poly 170°F Dn. Str.) Linear (Roller 75°F Dn. Str.) Roller 75°F Dn. Str. Steel 84°F Dn. Str. Poly 87°F Dn. Str. Poly 98°F Dn. Str. Poly 125°F Dn. Str. Poly 150°F Dn. Str. Poly 170°F Dn. Str. Linear (Roller 75°F Dn. Str.) Linear (Steel 84°F Dn. Str.) Linear (Poly 87°F Dn. Str.) Linear (Poly 98°F Dn. Str.) Linear (Poly 125°F Dn. Str.) Linear (Poly 150°F Dn. Str.) Linear (Poly 170°F Dn. Str.) 120 160 140 100 120 Load (lbs) Load (lbs) 80 100 60 80 40 60 20 40 20 0 0 -20 0 20 40 60 80 100 120 140 160 180 0 20 40 60 80 100 120 140 160 180 Side Load (lbs) Side Load (lbs) Figure 17 - Polished Rod Drag Relationships Figure 18 - Roller Drag Relationships Poly/Steel Drag Ratio Channel B "Downstroke" Coupling Drag Channel B "Down Stroke" (Forced Zero Intercept) 1.20 140 120 1.00 Roller 75°F Dn. Str. Steel 84°F Dn. Str. Poly 87°F Dn. Str. Poly 98°F Dn. Str. Poly 125°F Dn. Str. Poly 150°F Dn. Str. Poly 170°F Dn. Str. Linear (Steel 84°F Dn. Str.) Linear (Poly 87°F Dn. Str.) Linear (Poly 98°F Dn. Str.) Linear (Poly 125°F Dn. Str.) Linear (Poly 150°F Dn. Str.) Linear (Poly 170°F Dn. Str.) Linear (Roller 75°F Dn. Str.) Steel 84°F Dn. Str. Poly 87°F Dn. Str. Poly 98°F Dn. Str. Poly 125°F Dn. Str. Poly 150°F Dn. Str. Poly 170°F Dn. Str. Linear (Steel 84°F Dn. Str.) Linear (Poly 87°F Dn. Str.) Linear (Poly 98°F Dn. Str.) Linear (Poly 125°F Dn. Str.) Linear (Poly 150°F Dn. Str.) Linear (Poly 170°F Dn. Str.) 100 0.80 80 Drag Ratio Load (lbs) 0.60 60 40 0.40 20 0.20 0 0.00 -20 0 20 40 60 80 100 120 140 160 180 0 20 40 60 80 100 120 140 160 180 Side Load (lbs) Side Load (lbs) Figure 19 - Coupling Drag Data Figure 20 - Poly/Steel Drag Ratio Data HDPE / Steel Drag Ratio 0.70 0.60 0.50 y = 0.0020x + 0.3197 R2 = 0.9963 HDPE / Steel Ratio 0.40 0.30 0.20 0.10 0.00 90 100 110 120 130 140 150 160 170 180 Temp. (°F) B Dn. Str. Poly / Steel Ratio Linear (B Dn. Str. Poly / Steel Ratio) Figure 21 - HDPE/Steel Drag Ratio Relationship