Download
1 / 65
770 likes | 2.52k Views
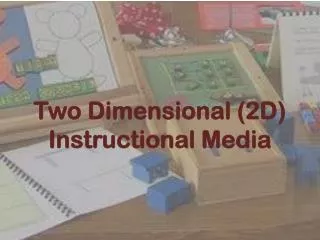
What is a Two-Dimensional (2D) Instructional Materials?. A two - dimensional (2D) instructional aterials consist only of lenght and width . . They are paper - based , opaque materials that are commonly found in classrooms .

E N D
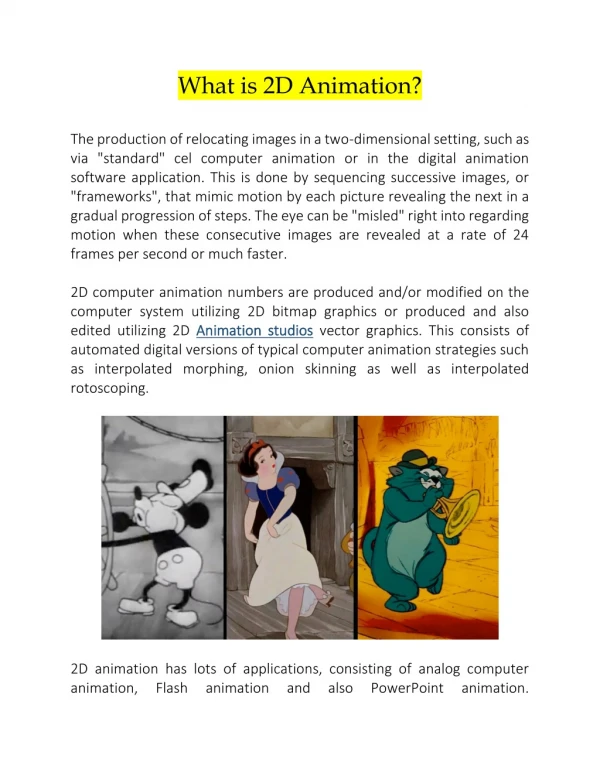
A two-dimensional (2D) instructionalaterialsconsistonly of lenght and width. They are paper-based, opaque materialsthat are commonlyfound in classrooms. This kind of materials do not needanyspecialequipment for its use.
Post Cards Boards Graphic Materials Flash Cards Pictures & Photographs
Graphic Materials • Translates ideas and relationships into a concrete form. • They are non-photographic, two-dimensional materials designed to communicate a message to the viewer. They often include verbal as well as visual symbols. • Graphics allow students to pick up on things missed verbally, reduce efforts in receiving messages, and they help focus attention. Best Practices in Using Graphics Advantages Graphic Materials Limitations
Advantages • It is readily available. • It can be easily carried from place to place. • It is inexpensive and can be reused. • It helps focus attention. • These convey certain types of information in a condensed form.
Limitations • This is not interactive. • It lacks depth and motion. • It can be easily misinterpreted. • This is written at a certain reading level. • It needs prior knowledge in order to interpret or understand what is presented.
Best Practices in Using Graphics • Use large visuals. • Use simple materials. • Cover irrelevant materials. • Use one at a time. • Teach learners how to interpret. • Ask questions for clarifications.
Chalkboards Hook and loop Boards Whiteboards and Magnetic Boards Pegboards Cloth Boards Bulletin Boards
Chalkboards Description Advantages Limitations
Description • Most common instructional media found in classrooms, rural and urban alike. • Chalk is used in writing on its surface and used as medium in verbal communication. • Used as a surface where pictures, posters, graphs, charts, etc. are posted to supplement instruction.
Advantages • It is generally suitable for different age groups, class size, and subject matter. • No special skill is needed to be able to use it. • It is not dependent on electricity. • It is economical and reusable.
Limitations • It does not provide a permanent record. • If it is not well-situated, viewing the contents of the board and reaching the top of the board becomes a problem. • Good handwriting and knowledge on proper spelling is a necessity. • Some information cannot be presented well using a chalkboard. • Chalk dust can trigger asthma or respiratory problem.
Whiteboards and Magnetic Boards Description Advantages Limitations
Description • It has glossy surface, commonly white in color, where non-permanent markings are made with the use of special felt pens. • Became popular around the 90s when there was a growing concern on the potential health risk of chalk dust. • These kind of boards are basically have the same use and purpose of a chalkboard.
Advantages • Using markers does not generate dust that comes from using and erasing chalk. • Whiteboard marker is easier to hold and write compared to chalk and marking a white board takes less time.
Limitations • It is more expensive than chalkboard and only special whiteboard markers are suitable for use on whiteboard. • The white background can cause problems to those with vision impairment. • Left-handed persons may find it difficult to write on these board because left-handed individuals usually write with their hand curved around the pen therefore causing their hand to drag across the strokes previously made.
Cloth Boards (Felt, Flannel and Carpet) Description Tips for Effective Use of Cloth Boards
Description • This is a piece of plywood or heavy cardboard covered with either felt, flannel or carpet. • The fuzzy surface of a felt, flannel, or carpet allows visual materials with appropriate backing to adhere. • The ff. will hold to these kinds of boards: felt, flannel, sandpaper, pellon, scouring pad and yarn. • Cloth boards are portable, simple to use, durable, colorful, and attractive. • These kinds of boards are best use for drills, positioning exercise, describing flow patterns, explaining relationships, and for short term display.
Tips for Effective Use • Place the board where all of your learners can have a good view of it. • Since these kinds of boards are small group media, you may sit down as you present, with learners seated on the chairs or on the floor in a semicircle. • Secure the board on an easel or lean it against a solid surface to ensure that it will not move during your presentation.
Tips for Effective Use • Arrange display materials in proper presentation order. • As you place the items on the board, press them against the cloth and shift it slightly to cause the two surfaces to interact and adhere. • “Talk to the students, not to the board” and maintain eye contact. • Store materials in a marked box.
Hook-and-Loop Boards ( Velcro Boards ) • In creating a hook-and-loop board, a plywood or heavy cardboard is covered with a nylon loop material and the nylon hooks are adhered on the back of the instructional materials to be displayed on the board. • These boards are used in similar fashion with cloth boards. • Its edge over the cloth board is that it has enough holding power to cause even heavy materials to stay on the board
Pegboards • Pegboards are made of tempered masonite with 1/8-inch holes drilled 1 inch apart. • These boards are used in displaying three-dimensional objects or heavy materials with the use of hooks inserted into the board.
Bulletin Boards Definition Factors to Consider when Choosing an Area for Bulletin Boards Tips for Successful Bulletin Board Display
Definition • Bulletin boards are generally not used directly in instruction but tend to be a supplement”( Kemp, J. & Smellie, D., 1994). • They are used to introduce or follow up lessons presented. • These boards are usually designed as an instructional device that can carry a message without the presence of a teacher. • Other uses of bulletin boards are the following: for displaying notices and announcements, classroom rules and procedures, seasonal items and student work.
Factors to Consider when Choosing an Area for Bulletin Boards • Select a place where there is a steady student traffic. • Avoid corners. • Avoid wall behind a desk. • Select a well-lighted place. • Place board on the wall at the reading level of your learners.
Tips for Successful Bulletin Board Display • Always update the information displayed. • Ensure that the display is neat and accurate. • Make sure there is balance between text and graphics or pictures. • Make sure that the size of the text can be read from a distance or the graphics o pictures can be seen from a distance.
Drawing and Sketches Posters Diagrams Cartoons Graphs Maps Strip Drawings Flip Charts Charts
Drawing and Sketches • Drawings and sketches employ the use of lines, either simple or crude. They may not be the real thing but they may represent persons, places, things, and concepts. • In general, drawings are more finished and representational compared to sketches. • There are times, when there is a need to illustrate something on the board. Therefore, sketching or drawing is an important skill that a teacher should learn in order to be understood as one lecturers.
Cartoons Definitions Suggestions for the Use of Cartoons
Definitions • Cartoons are symbolism and oftentimes bold exaggeration to present at a glance a message or point concerning news or events, people or situations. • This pictorial representation of a person, idea or situation should be drawn around a single idea and presented in a challenging manner. • Cartoons can be used as a springboard for a lesson, for a follow-up activity, or for evaluation purposes.
Suggestions for the Use of Cartoons • Take into consideration the age and experience or maturity of the target learners. • The cartoon should not contain so many details but only the essential features. • Short and direct captions are used only when necessary. • Use symbols that are clear and conventional. ( dove for peace, owl for wisdom, coffin for death, turtle for slow, etc.) • Make sure that the cartoon is big enough to be seen.
Strip Drawings It is a form of cartooning in which a cast of characters enacts a story in a sequence of closely related drawings. Strip drawing is a more accurate term for the commonly called comic or comics strip (Dale, 1969). Strip drawings can be used for motivation or starter for a lesson. It can also be used as an activity for students to express leaning gained. When making of strip drawings, make sure that they are not only educational but also entertaining.
Posters Definition What a good poster should possess?
Definitions • Posters are combination of lines, images, colors, and words. They are intended to catch attention and communicate a message quickly. • Posters can be used to stimulate interest in a new topic, a special class, or a new event, • In selecting a poster to use, make sure that it is appropriate to the grade level, subject, and purpose.
A good poster possesses the following characteristics: • It is simple but bold and dramatizes features. • Only a few words are used and key words are made to standout. • It is attractive and pleasing to the eyes. • The design and color are carefully selected. • It must have elements of dynamism and shock.
CHARTS Are graphic representation of abstract relationships such as chronologies, quantities, and hierarchies ( Heinich, R., Molenda, M., & Russel, D., 1993) Examples
Organizational Chart These show as organization’s structure or command. It illustrates the interrelationships between the different parts of an organization
Classification Chart They are similar to organization charts but its purpose is to show the classification or categorization of objects, events, or species. An example is a chart showing the classification of plants or animals according to characteristics or specie.
Time Lines Time lines show in sequence different events or the relationship of people and events. To show the important concepts, pictures or drawings are added.
Tabular Charts They contain numerical information or data in a table or columns
Flowcharts or Process Chats These kinds of charts show a process, sequence, or procedure.
Tree or Stream Charts These kinds of charts show change, growth or development by beginning with a single course and then spreads out into many branches or by beginning with many branches which then come together into a single channel.
Gannt Chart A gannt chart is an activity time chart illustrates the start and finish dates of a certain activity or project.
Graphs It shows quantitative data. These kinds of graphics make analysis and interpretation of numerical information easier. Examples
Line graph They are used when plotting trends of relationships between series of data. It shows the progress over a period of time.
Bar Graphs Bar graphs are the simplest and easiest to read. The data are presented in horizontal or vertical bars. While the widths of the bars are the same, its length represents the amount or percentage data.
Pie Graph or Circle Graph The section of these kinds of graphs represent the parts of a whole. These graphs always present whole amounts and its parts are calculated in percentage or fractional parts.
Area o Solid Graphs They are used to compare several related totals thru the use of geometric shapes
Pictorial Graphs or Pictographs These graphs utilize related pictures or drawings to show numerical data. It is an adaption of the bar graph.