Download
1 / 1
10 likes | 96 Views
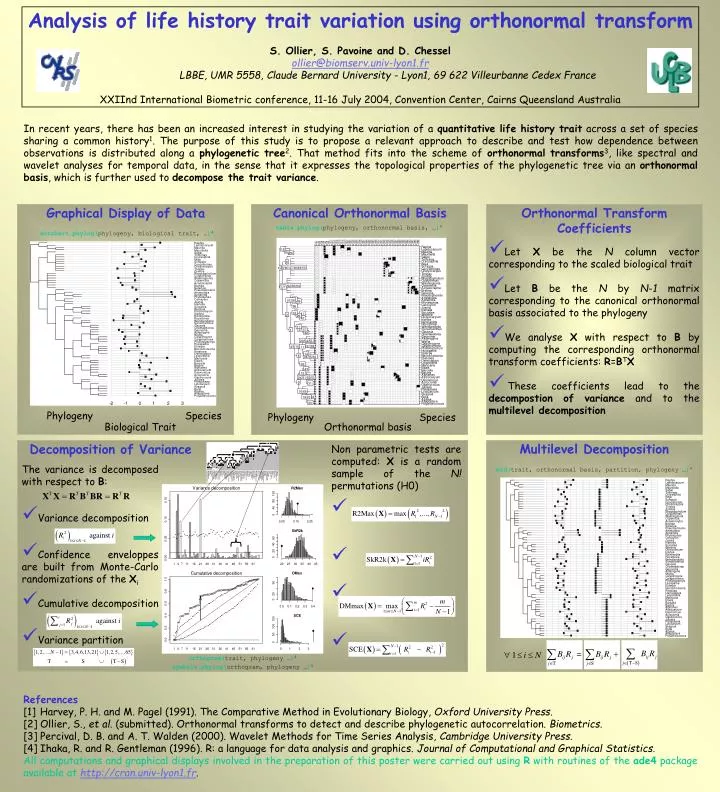
Orthonormal Transform Coefficients. Let X be the N column vector corresponding to the scaled biological trait Let B be the N by N-1 matrix corresponding to the canonical orthonormal basis associated to the phylogeny

E N D
Orthonormal Transform Coefficients • Let X be the N column vector corresponding to the scaled biological trait • Let B be the N by N-1 matrix corresponding to the canonical orthonormal basis associated to the phylogeny • We analyse X with respect to B by computing the corresponding orthonormal transform coefficients: R=BTX • These coefficients lead to the decompostion of variance and to the multilevel decomposition Multilevel Decomposition mld(trait, orthonormal basis, partition, phylogeny …)4 Analysis of life history trait variation using orthonormal transform S. Ollier, S. Pavoine and D. Chessel ollier@biomserv.univ-lyon1.fr LBBE, UMR 5558, Claude Bernard University - Lyon1, 69 622 Villeurbanne Cedex France XXIInd International Biometric conference, 11-16 July 2004, Convention Center, Cairns Queensland Australia In recent years, there has been an increased interest in studying the variation of a quantitative life history trait across a set of species sharing a common history1. The purpose of this study is to propose a relevant approach to describe and test how dependence between observations is distributed along a phylogenetic tree2. That method fits into the scheme of orthonormal transforms3, like spectral and wavelet analyses for temporal data, in the sense that it expresses the topological properties of the phylogenetic tree via an orthonormal basis, which is further used to decompose the trait variance. Graphical Display of Data Canonical Orthonormal Basis table.phylog(phylogeny, orthonormal basis, …)4 dotchart.phylog(phylogeny, biological trait, …)4 Phylogeny Species Phylogeny Species Biological Trait Orthonormal basis Decomposition of Variance Non parametric tests are computed: X is a random sample of the N! permutations (H0) The variance is decomposed with respect to B: • Variance decomposition • Confidence enveloppes are built from Monte-Carlo randomizations of the Xi • Cumulative decomposition • Variance partition orthogram(trait, phylogeny …)4 symbols.phylog(orthogram, phylogeny …)4 References [1]Harvey, P. H. and M. Pagel (1991). The Comparative Method in Evolutionary Biology, Oxford University Press. [2] Ollier, S., et al. (submitted). Orthonormal transforms to detect and describe phylogenetic autocorrelation. Biometrics. [3] Percival, D. B. and A. T. Walden (2000). Wavelet Methods for Time Series Analysis, Cambridge University Press. [4] Ihaka, R. and R. Gentleman (1996). R: a language for data analysis and graphics. Journal of Computational and Graphical Statistics. All computations and graphical displays involved in the preparation of this poster were carried out using R with routines of the ade4 package available athttp://cran.univ-lyon1.fr.