Download
1 / 47
480 likes | 647 Views
Usability Evaluation with Users. CMPT 281. Outline. Usability review Observational methods Interview methods Questionnaire methods. Usability. ISO 9241-11:

E N D
Usability Evaluation with Users CMPT 281
Outline • Usability review • Observational methods • Interview methods • Questionnaire methods
Usability • ISO 9241-11: • The extent to which a product can be used by specified users to achieve specified goals with effectiveness, efficiency, and satisfaction, in a specified context of use • Efficiency • Effectiveness • Satisfaction • Context: user, task, environment
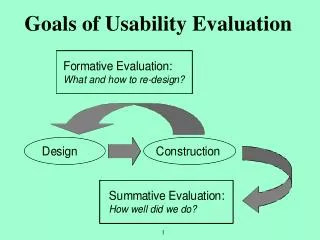
Operationalizing usability How to assess usability criteria? What measures? What thresholds? What is “usable enough?”
Observational Methods • Simple observation • Think-aloud protocols • Retrospective think-aloud protocols • Co-discovery learning • Recording observations
Simple Observation User is given a task, and evaluator just watches the user Problem: no insight into the user’s decision process or attitude
Think-aloud Protocol • Subjects are asked to say what they are thinking/doing: • What they believe is happening • What they are trying to do • Why they took an action • Gives insight into what the user is thinking
Think-aloud Protocol • Problems: • Awkward/uncomfortable for subject (thinking aloud is not normal!) • “Thinking” about it may alter the way people perform their task • Hard to talk when they are concentrating on problem • Still the most widely used method in industry
Retrospective Think-aloud • Problems with Think-aloud: • Awkward for subject (thinking aloud not normal!) • “Thinking” about it may alter the way people perform their task • Hard to talk when they are concentrating on problem • Solution: videotape the experience, perform a retrospective think-aloud • Has its own problems • Awkwardness of watching themselves on video • Awkwardness of reliving mistakes • Reflection of the experience rather than in context
Co-discovery Learning • Two people work together on a task • Normal conversation between the two users is monitored • Removes awkwardness of think-aloud, more natural • Provides insights into thinking process of both users
Field Studies • Observe ‘in the field’ = natural environment • Sit and observe • Video records • Join the culture (ethnography)
Field Studies • Observe ‘in the field’ = natural environment • Sit and observe • Video records • Join the culture (ethnography) • Requires that the system be fully deployed • Highest degree of realism • Can be highly specific to the particular setting • Can take a long time
Recording Observations • Paper and pencil • primitive but cheap • evaluators record events, interpretations, and extraneous observations • evaluator seems disengaged • problem: writing is slow • prepared coding schemes can help; just tick off events • Audio recording • capture discussion (think aloud, co-discovery) • hard to synchronize streams (e.g., interface actions) • (expensive) tools exist to help • transcription is slow and difficult! • tools exist to help
Recording Observations • Video recording • can see what a user is doing • (good to use one camera/scan converter for screen + one for subject) • can be intrusive (at least initially) • analysis can be challenging • annotation is time consuming and dull • Companies often build “usability labs” with one-way mirrors, video cams, etc.
Analyzing Observation Data • Qualitative data: • interpreted to “tell a story” • Qualitative data: • categorized • Quantitative data: • presented as values, tables, charts, and graphs • often treated with statistical tests • How do you know which analysis is appropriate? • Depends on what you are using it for
Querying Users with Interviews • “conversations with a purpose” • excellent for pursuing specific issues • more interactive than observation: address specific issues of interest • more flexible than questionnaires: probe more deeply on interesting issues as they arise • problems • accounts are subjective • time consuming (to conduct and to analyze) • evaluator can bias the interview • prone to rationalization of events/thoughts by user • user’s reconstruction may be wrong
Planning the Interview • general • what is the purpose of the interview? • how many people? (breadth vs. depth) • length of interview & number of sessions • scheduling interviews (location, times, people) • will the interview be recorded? (audio, video; transcription) • avoid: • asking long questions • using compound sentences • using jargon • asking leading questions • … and generally be alert to unconscious biases.
Interviews control & pre-determined questions • three main types: • open-ended / unstructured • semi-structured • structured • other categories (can include types above): • group • retrospective
Unstructured Interviews So, difficult to use forquantitative study • most like a conversation, often go into depth • open questions • exploratory key is to listen rather than talk: practice silence! • pros/cons: + rich data, things interviewer may not have considered - easy to go off the rails - time-consuming & difficult to analyze - impossible to replicate
Structured Interviews Think telephone survey • predetermined questions (like questionnaire, often with a flowchart) • closed questions • short, clearly worded questions • confirmatory • pros/cons: + replicable - potentially important detail can be lost better (cheaper) with a questionnaire?
Semi-structured Interviews Between structured & unstructured Uses elements of both In usability studies, unstructured and semi-structured are the most common
Group Interviews (Focus Group) • 3 – 10 people interviewed at one time • usually has agenda, but may be structured/unstructured • skilled moderator critical! • usually recorded • pros/cons: + can accommodate diverse and sensitive issues + opinions developed within a social context + good way to locate “proto-users”: most articulate, imaginative participants can help later w/participatory design - some interviewees may dominate - expensive: usually pay participants + professional moderator - people may not know what they think (or be afraid to express it)!
Do you know why you never tried that option? I didn’t see it. Why don’t you make it look like a button? Retrospective Interview • post-test interview to clarify events that occurred during system use: record what happened, replay it, and ask about it • pros/cons: + excellent for grounding apost-test interview + avoids erroneous reconstruction + users often offer concrete suggestions - requires a second session
Overview of an Exploratory Interview • explain purpose of the interview • allow time to get acquainted with the interviewee • provide understanding and background • enumerate activities • find out what the user does • explain work methods • find out how the user does things (skills and knowledge) • trace interconnections • determine other people and activities that are related • identify performance issues • explore current problems and impediments to success
Things You Uncover during Interviews • exceptions • lots of things people do are not “in the manual” • many jobs evolve to fit changing circumstances • much of this is not documented • many times “management” does not know about this • domain knowledge • most people know a lot about their jobs, and those they work with • terminology, common phrases, specific details • audio recording helps capture this • video recording helps provide body language • written notes can provide context, but not always details
Querying Users with Questionnaires • closed or open questions • get evidence of wide general opinion • or experiences after an experiment • pros/cons: + preparation expensive, but administration cheap can reach a wide subject group (e.g. mail or email) + does not require presence of evaluator + results can be quantified - risk: low response rate and/or low quality responses
Deeper issue: actions vs. beliefs vs. intentions Questionnaires: Designing Questions • establish the purpose of the questionnaire: • what information is sought? • how would you analyze the results? • what would you do with your analysis? • determine the audience you want to reach • typical: random sample of between 50 and 1000 users of the product -- why a random sample? • test everything before sending it out: • test the wording • test the timing • test the validity • test the analysis
Styles of Questions: Open-ended • asks for opinions • good for general subjective information • but difficult to analyze rigorously • E.g., “can you suggest any improvements to the interface?”
Styles of Questions: Closed What does each answer mean?? • restricts responses by supplying the choices for answers • can be easily analyzed … • but can still be hard to interpret, if questions / responses not well designed! alternative answers should be very specific Do you use computers at work: O often O sometimes O rarely In your typical work day, do you use computers: O over 4 hrs a day O between 2 and 4 hrs daily O between 1 and 2 hrs daily O less than 1 hr a day
Styles of Questions: Scalar - Likert Scale Often multiple questions to triangulate underlying concept Connect to affinity diagram • measure opinions, attitudes, and beliefs • ask user to judge a specific statement on a numeric scale • scale usually corresponds to agreement or disagreement with a statement Characters on the computer screen are hard to read: strongly agree strongly disagree 1 2 3 4 5
Styles of Questions: Scalar - Semantic Differential Scale • clear 1 2 3 4 5 confusing • attractive 1 2 3 4 5 ugly explore a range of bipolar attitudes about a particular item each pair of attitudes is represented as a pair of adjectives WebCT is:
Styles of Questions: Multi-Choice Will the latter work? Consider blanks. • respondent offered a choice of explicit responses How do you most often get help with the system? (tick one) O on-line manual O paper manual O ask a colleague Which types of software have you used? (tick all that apply) O word processor O data base O spreadsheet O compiler
Styles of Questions: Ranked • respondent places an ordering on items in a list • useful to indicate a user’s preferences • forced choice Rank the usefulness of these methods of issuing a command (1 most useful, 2 next most useful..., 0 if not used) __2__ command line __1__ menu selection __3__ control key accelerator
Stylesof Questions:Combining Open-ended & Closed Questions the undo facility is great! • gets specific response, but allows room for user’s opinion It is easy to recover from mistakes: disagree agree comment: 1 2 3 4 5
Herman Miller – Aeron Chair • Comfort Likert • 1-10 (want 7.5) • Got 4.5 • Eventually inched up to 8 before release • Aesthetics Likert • 1-10 • Got 2-3 (never above 6!) • Usually a relationship between these two but it didn’t happen! • Focus Group • Check on pricing • Architects and designers liked • Facility managers and ergonomicists hated! • Entire design was *actually* user friendly • Where is this chair at today?
Considerations • Style of Questions • Open Ended • Closed • Choose one • Choose all that apply • Ratings (scale) • Rankings • Ease of Analysis • Poor • Depends • Easy • Somewhat easy* • Easy • Somewhat easy *Note: Can’t really make a pie chart if the responses don’t add up to 100%
Be Considerate of Your Respondents • not just because it’s nice, but it works better. • questionnaire length (short is good): • think in terms of reasonable completion times • do not ask questions whose answers you will not use! • privacy invasions: be careful how / what you ask • motivation • why should the respondent bother? • usually need to offer something in return … but be careful about introducing bias.
Deployment Issues • Online/email • html • tools • U of S survey tool • Survey Monkey • Choice impacts ease of analysis • 10000 responses? Go directly to database…
Presenting questionnaire results Choose one
Presenting questionnaire results Choose one Choose all that apply
Summary: Questionnaires • Establish purpose • Determine audience • Variety of administration methods(for different audiences) • Design questions:many kinds, depend on what you want to learn • Be considerate of your respondents • Motivate your respondents (without biasing them).