Download
1 / 28
280 likes | 435 Views
An-Najah National University Civil Engineering Department Hydraulic Analysis of the water distribution Network of Jenin City with emphasis on Jenin Camp using EPANET Prepared by: Faisal Nasrallah Oday Daoud Supervisor: Dr. Mohammad N. Almasri 2010 – 2011.

E N D
An-Najah National UniversityCivil Engineering DepartmentHydraulic Analysis of the water distribution Network of Jenin City with emphasis on Jenin Camp using EPANET Prepared by: Faisal Nasrallah Oday Daoud Supervisor: Dr. Mohammad N. Almasri 2010 – 2011
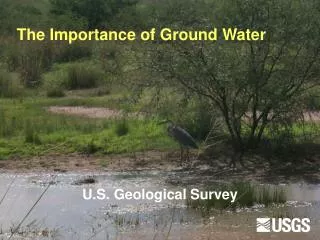
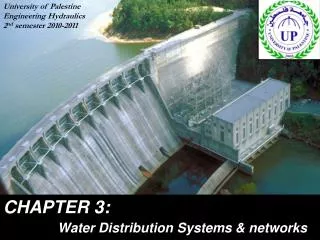
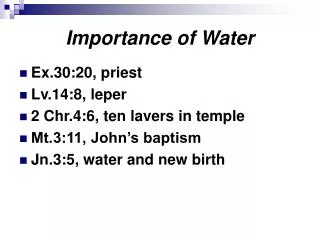
The importance of water distribution networks • Water distribution networks (WDNs) are used to transmit and distribute water from its sources to the houses and all consumption locations. • WDNs decreases the efforts, time and make life easier than in the past time. • The efficiency of WDNs are very important, and to check on this, a hydraulic analysis is carried out.
Purposes of project • In this project, there are two main objectives: • 1.To study the water resources for Jenin City. • 2.To make a hydraulic analysis of Jenin WDN with emphasis on Jenin camp using EPANET under the following two different scenarios: • a. Existing steady – state conditions. • b. Future steady – state conditions.
Methodology Data Collection Collects map & missing data. Prepare map by AtuoCAD Solve the problems to provide suitable data. Model Development Use EPANET & GIS programs. Velocity & Pressure in steady & future state. Evaluation of Results Conclusions and Recommendations Improve WDN for Jenin Camp.
Description of study area • Jenin is a Palestinian city located in the north of the West Bank. • The population of Jenin City is • 49,371 persons in 2007. • The highest elevation in Jenin • City is 280 m while the lowest • elevation is 108 m. • Jenin Camp is located in the south – west of Jenin City.
Problem in WDN • These figures indicate some problems in water distribution network maps for Jenin City.
Input Data • Convert WDN from AutoCAD to EPANET.
Input Data • The length for all pipes converted • From AtouCAD to EPANET • automatically. • Hazen Williams Coefficient depend • On the age & type of pipe.
Input Data • Elevation for nodes using GIS • 1. Convert maps to GIS
Input Data 2. Spatial join in GIS
Input Data 3. Results for spatial join
Input Data • Diameter for pipes • All diameters in the WDN for all • Jenin City ( around 7000 pipe ) • was inserted manually. • Demand for nodes • = (Consumption / Population)
Existing steady – state analysis • Demand • Demand =Consumption / Population • = 70 L/c – day • But this value must be multiplied by two factors • Losses factor • Supply factor
Existing steady – state analysis • Results • Pressure • There is no negative pressure in WDN for Jenin Camp • The highest value of pressure is 216 m. • The lowest value of pressure is 36 m.
Existing steady – state analysis • Velocity • Values of velocity in Jenin Camp range from 0.01m/s to 4.0 m/sec. • The high values of velocity results from small pipe diameters, but the low values of velocity results from large pipe diameters.
Future steady – state analysis • Demand • In this case the future analysis for the existing network after 25 year from now • To estimate the future water demand for each node, the • existing water demand will be multiplied by a factor
Future steady – state analysis Factor = 2.58 The population after 25 years = 83,640 According to WHO the future consumption per capita ( 100 – 150 ) L / c – day Assume future consumption = 100 L / c – day
Future steady – state analysis • Before modification ( Pressure ) • When we changed the demand for the future demand we had negative pressure and high velocity
Future steady – state analysis • Before modification ( Velocity )
Future steady – state analysis • After modifications • We changed selected pipes diameters to make pressure above 20m and the velocity within the range (0.3-2 m/s). • The range of the pressure values is between 85 m • To 210 m • The range of velocity is between 0.3 m/s to 2 m/s
Future steady – state analysis • After modifications ( Pressure)
Future steady – state analysis • After modifications ( Velocity )
Conclusions • The head loss is very high • Different values of velocity. The range of velocity in existing network between (0.01 – 4m/s) • High pressure due to variation in topography in Jenin Camp. Since the elevations range from 143 to 265 m • The water losses in Jenin WDN are very high where part of that is attributed to leakage.
Recommendations • To reduce water pressure, the pressure reduce valve (PRV) must be added in the area that contains high pressure • Reduce the water losses • All pipes in Table 7.1 in our project must be changed in future design to satisfy the specifications for velocity and also the pressure
Recommendations Some of pipes that the diameter must be changed
THE END THANKS FOR YOUR ATTENTION