Download
1 / 38
380 likes | 575 Views
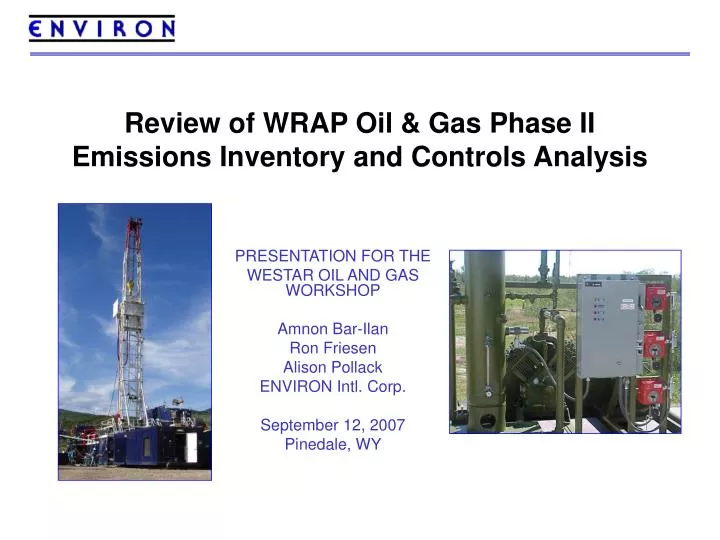
Review of WRAP Oil & Gas Phase II Emissions Inventory and Controls Analysis. PRESENTATION FOR THE WESTAR OIL AND GAS WORKSHOP Amnon Bar-Ilan Ron Friesen Alison Pollack ENVIRON Intl. Corp. September 12, 2007 Pinedale, WY. WRAP Phase II Project Overview.

E N D
Review of WRAP Oil & Gas Phase IIEmissions Inventory and Controls Analysis PRESENTATION FOR THE WESTAR OIL AND GAS WORKSHOP Amnon Bar-Ilan Ron Friesen Alison Pollack ENVIRON Intl. Corp. September 12, 2007 Pinedale, WY
WRAP Phase II Project Overview • Project was focused on developing an improved emissions inventory of oil and gas exploration and production area sources in the WRAP region • Area source categories included compressor engines, drilling rigs, heaters and other wellhead equipment • Previous emission inventory (EI) efforts: • - WRAP Phase I analysis, 2002 and 2018 (completed 2005) • NMED EI for San Juan and Rio Arriba counties (completed 2006) • Specific objectives of the Phase II project: • Emissions inventory improvements for 2002 • Current base year updates for 2005 • 2018 growth factor projections improvements • Control technology evaluations and control strategies scenarios • 2018 point source SO2 emissions improvements
Western States Oil & Gas Regions of Interest Major basins of O&G activity in Phase II analysis: Permian Basin (NM) San Juan Basin South (NM) San Juan Basin North (CO) Uinta-Piceance Basin (CO and UT) Denver-Julesburg Basin (CO) Paradox Basin (UT) Green River Basin (WY) Wind River Basin (WY) Big Horn Basin (WY and MT) Powder River Basin (WY and MT)
2002 Emissions Inventory Improvements • New methodology estimated 2002 emissions on a basin-wide average basis for all basins in the WRAP region, focusing on those basins where major O&G activities are occurring and detailed producer information is available • In basins where significant activity was not occurring, or producer information was unavailable, used Phase I estimates
Data Collection from O&G Producers • Data were collected from most major and some medium-sized and independent oil and gas companies operating in the WRAP region • Data collection was in the form of a questionnaire sent to each producer • Information was provided on: • - Overall activity (i.e. number of wells, gas production, etc.) • - Equipment used and equipment counts • - Emissions controls in use or planned • - Projections of future activity, demand, and production in the region
Overview of Methods • Basin-specific emissions estimates were made using activity and equipment information provided directly by the producers • - Previous Phase I work used available data from limited areas and generalized to WRAP region • For Phase II EI improvements, focus was on well-head compressors and drilling rigs as area sources • Focused basin list only – these are the areas where major oil and gas activity is occurring or expected to occur • Updated baseline emissions year from 2002 to 2005 • Revised 2018 projections using most recent planning information available and producer data where available
2002 Emissions InventoryDrilling Rig Emissions • Improved estimate of actual drilling time by formation and basin from producer information on drilling times (rather than spud date and well completion date) • Improved estimate of average drilling rig engine load by formation and basin • Determined average horsepower requirements by formation and basin and identified most often used or representative makes/models of drilling rig engines • Incorporated manufacturer’s rated emissions factors for makes/models identified, or producers’ emissions tests where available • Incorporated SO2 emissions factors (based on sulfur content of fuel)
2002 Emissions InventoryDrill Rig Emissions - TPY Note: Emissions estimates include data from previous work for the NMED in the San Juan Basin and the Southern Ute Note: Emissions estimates include data from previous work for the NMED in the San Juan Basin and the Southern Ute inventory in Colorado
2002 Emissions InventoryCompressor Engine Emissions • Determined for each basin either (a) the average percentage of wells with wellhead, lateral and central compression, or (b) percentage of total HP with wellhead, lateral or central compression • Did not include central and lateral compressors that have been counted in a point source inventory for each state • Determined for each basin a representative or most often used make/model of compressor, including HP and rated or tested emissions factors • Determined for each basin an average load factor for wellhead/lateral compressors • Basin-wide emissions estimate on the basis of total well count
2002 Emissions InventoryCompressor Engine Emissions - TPY Note: Emissions estimates include data from previous work for the NMED in the San Juan Basin and the Southern Ute inventory in Colorado. Other Colorado compressor emissions are assumed to be part of Colorado’s point source inventory and are not included here.
2002 Emissions InventoryExploration & Production • Previous Work included: • Tanks - flashing, working and breathing losses (VOC) • Glycol dehydration units (VOC) • Heaters (VOC and NOx) • Pneumatic Devices (VOC) • Completion-venting and flaring (VOC, NOx, CO) • Work Plan identified potential additional work, if resources permitted, to estimate VOC from: • Venting (from unloading fluids) • Fugitives (using typical well diagrams) • Dehydrators (look at point source vs. area source distribution) • Resources did not allow this work to be completed
Additional Categories CBM Engines • Emissions from CBM wells were addressed through estimating drilling rig and compressor emissions • Previous estimates for CBM pump engine emissions were not updated Fugitive Dust Emissions • Resources did not allow estimating fugitive dust emissions
Updated 2002 → 2005 Emissions • Objective was to update base year for projections from 2002 to 2005 using newly available state OGC data for 2005 • 2005 represents a more current base year for projections and can be used as a second “data point” to verify projections methodology • Methodology was to first update 2002 emissions using the methodology described here, then to scale up 2002 data using 2005 OGC well count or production • In areas with no production or wells in 2002, but with production or wells in 2005 emissions were scaled based on state average emissions per well (or per production unit)
Updated 2002 → 2005 Emissions2005 Compressor Engine Emissions - TPY Note: Emissions estimates include data from previous work for the NMED in the San Juan Basin and the Southern Ute inventory in Colorado. Other Colorado compressor emissions are assumed to be part of Colorado’s point source inventory and are not included here.
2018 Emissions • Emissions estimated for county-level emissions in WRAP region for: • NOx, SO2, VOC, CO • Emissions included updated growth projections from Resource Management Plans, Alaska Oil & Gas Report, and National Energy Forecast released by the Energy Information Administration (EIA) • Projected emissions to 2018 using 2005 base case and growth factors • State controls evaluated: • - Wyoming BACT requirements for permitted sources • Colorado controls requirements for point sources (ERG) • Utah BACT requirements for compressors • Federal controls evaluated: • - Federal nonroad engine standards • - EPA nonroad diesel fuel sulfur content standards
2018 Emissions ProjectionsCompressor Engines - TPY Note: Colorado 2018 emissions projections for compressor engines are applied only to the Southern Ute inventory. All other compressor emissions are assumed to be part of Colorado’s point source inventory and are not included here.
2018 NOx Emissions ProjectionsAll O&G Sources *Note: Colorado 2018 emissions projections for compressor engines are applied only to the Southern Ute inventory. All other compressor emissions are assumed to be part of Colorado’s point source inventory and are not included here.
2018 SOx Emissions ProjectionsAll O&G Sources *Note: Colorado 2018 emissions projections for compressor engines are applied only to the Southern Ute inventory. All other compressor emissions are assumed to be part of Colorado’s point source inventory and are not included here.
Discussion of Phase I vs Phase II NOx and SOx Emissions Inventory • Wyoming NOx emissions decrease from 2005 to 2018 – due to wellhead compressor emissions reduction, implementation of the BACT controls requirement by 2018 • Oil vs. gas wells – corrected the Phase I assumption of emissions based on all gas production, no gas equipment on oil wells. • SO2 emissions in both 2002 and 2018 have been reduced from Phase I due to improved estimates of actual drilling times based on producer feedback • General trend in both Phase I and Phase II analyses is for SOx emissions to decrease substantially by 2018 due to the phase-in of ultra-low sulfur diesel fuel
2018 Point Source SO2 Emissions • Revised Pechan report on 2018 SO2 emissions projections to incorporate ENVIRON projection methodology and producers’ information on growth forecasts and emissions controls • Identified major SO2 point source emissions sources in each state of interest • Obtained producer information on control strategy effectiveness, implementation rate, timetable and growth trends from 2002 – 2005 as well as for 2018 based on production forecasts • Conducted review of Title V Permits to determine emissions with and without control technologies • Revised estimates of 2018 emissions
Controls Evaluated • Developed a series of white papers on control technologies for drill rigs and compressors and some VOC sources • White papers include only those technologies deemed technically feasible now • List of control technologies includes: • Engine modifications (e.g., lean-burn engines, ignition timing) • Aftertreatment control devices (e.g., catalysts, exhaust gas recirculation) • Engine replacement/repowering • VOC controls (e.g., dehydrators, pneumatics)
White Papers • Control effectiveness • Capital and Operating Cost • Potential emissions reduction • Cost-effectiveness ($/ton)
Sources of Information • ENVIRON Field Tests • Pilot Project to Assess the Effectiveness of an Emission Control System for Gas Compressor Engines in Northeast Texas – 2006 • Results from 19 emission tests on 8 different compressor engines less than 500 hp • Demonstrated the control efficiency of NSCR using AFR controllers in remote applications • Selected Studies and Sources of Information • Technology Demonstration Report – Selective Catalytic Reduction and Bi-Fuels Implementation on Drill Rig Engines, prepared for Shell Rocky Mountain Production LLC and Ultra Petroleum Inc., Pinedale, WY, June 2006. • Manufacturers of Emissions Control Association, Stationary Engine Emission Control, May 2002 • Personal Communications with Emission Control Equipment Manufacturers • 4 Corners Air Quality Task Force (AQTF) • Draft Report of Mitigation Options, Version 5, January 10, 2007(update this) • Conference Calls with the Mitigation Options Workgroup
Sources of Information (continued) • U.S. EPA Control Technology Guidelines • Stationary Reciprocating Internal Combustion Engines, Alternative Control Techniques Document, EPA-453/R-93-032 • Final Regulatory Support Document: Control of Emissions from New Marine Compression-Ignition Engines Above 30 Liters Per Cylinder EPA-420-R-03-004 • California Air Resources Board RACT/BARCT Determinations • Determination of Reasonably Available Control Technology and Best Available Retrofit Control Technology for Stationary Spark-Ignited Internal Combustion Engines – 2001 • Includes more than 2,500 test results for engines permitted in California • NESCAUM Studies • Stationary Diesel Engines in the Northeast: An Initial Assessment of the Regional Population, Control Technology Options, and Air Quality Policy Issues – 2003 • Status Report on NOx Controls for Gas Turbines, Cement Kilns, Industrial Boilers, Internal Combustion Engines, Technologies and Cost Effectiveness, Northeast States for Coordinated Air Use Management, December 2000. • EPA Natural Gas Star Program • Lessons Learned from Best Management Practices • Technology Reports on Best Management Practices
Summary of Control Options Under Consideration:Compressor Engines 1 NSCR - Non-selectic catalytic reduction AFR - Air Fuel Ratio Control, ITR - Ignition Timing Retard, PSC - Prestratified Charge, L-E - Low Emission Engine, SCR - Selective Catalytic R, eduction, EGR - Exhaust Gas Recirculation, CEC - Crankcase Emission Control, DPF - Diesel Particulate Filter, DOC - Diesel Oxidation Catalyst, LNC - Lean NOx Catalyst, NG - Natural Gas, VRU - Vapor Recovery Unit
Summary of Control Options Under Consideration: Drilling Rigs 1 NSCR - Non-selectic catalytic reduction AFR - Air Fuel Ratio Control, ITR - Ignition Timing Retard, PSC - Prestratified Charge, L-E - Low Emission Engine, SCR - Selective Catalytic R, eduction, EGR - Exhaust Gas Recirculation, CEC - Crankcase Emission Control, DPF - Diesel Particulate Filter, DOC - Diesel Oxidation Catalyst, LNC - Lean NOx Catalyst, NG - Natural Gas, VRU - Vapor Recovery Unit
Summary of Control Options Under Consideration: Other Wellhead Sources 1 NSCR - Non-selectic catalytic reduction AFR - Air Fuel Ratio Control, ITR - Ignition Timing Retard, PSC - Prestratified Charge, L-E - Low Emission Engine, SCR - Selective Catalytic R, eduction, EGR - Exhaust Gas Recirculation, CEC - Crankcase Emission Control, DPF - Diesel Particulate Filter, DOC - Diesel Oxidation Catalyst, LNC - Lean NOx Catalyst, NG - Natural Gas, VRU - Vapor Recovery Unit
Controls Analysis • Compressor Engines • Cost-effectiveness and NOx reduction potential estimated for range of compressor engines across WRAP region • Engine size ranged from 50 hp – 300+ hp • Drilling Rigs • Cost-effectiveness and NOx reduction potential estimated for range of drilling rigs across WRAP region • If multiple engines are present on a single rig, control is applied to all engines and the overall “rig” cost-effectiveness and NOx reduction potential reported • Drilling rig engines sizes vary from 200 hp – 1500 hp • Drilling rig engines vary widely in activity
Controls Analysis – Example Calculation:Drilling Rigs Varies with geographic area, average is based on available data from producers Varies by basin, calculation conducted for each basin No anticipated VOC reduction for this example control measure
Summary of Emissions Reductions and Cost-Effectiveness: Drill Rigs
Summary of Emissions Reductions and Cost-Effectiveness: Compressor Engines
Control Options: Summary • For drill rigs most controls fall within the $750/ton-NOx - $2000/ton-NOx range • Exceptions for emulsified fuel, SCR systems which have higher cost-effectiveness • For compressor engines most controls have C-E values $1000/ton-NOx or below except SCR/NSCR • Further information needed on bi-fuel engines and cost – NG cost, infrastructure, piping, etc.
Emissions Control ScenariosProposed Work • For each viable control technology, estimate emissions reduction potential for O&G area sources in each state - Consider controls currently in place - Consider controls required by states and EPA in the future • Focus analysis not only on compressors and drill rigs but also exploration and development sources of VOC emissions • Develop scenarios to show emissions reductions for a range of • Growth projections • Control technology penetration rates • Estimate costs for each scenario • - Consider costs already incurred • - Consider incremental costs and cost-effectiveness where appropriate
Future Work on Oil and Gas Emissions Inventory • Independent Petroleum Association of the Mountain States (IPAMS) is considering funding a Phase III oil and gas inventory • Phase III would be a collaboration between IPAMS, major oil and gas companies, WRAP and/or other state agencies to develop most comprehensive oil and gas emissions inventory to date • Phase III inventory would improve estimates of all source categories from oil and gas operations and include all major criteria pollutants (NOx, SOx, VOC) • Engines (e.g. drilling rigs, compressors, CBM pumps) • VOC sources (e.g. pneumatic devices, flares, tank condensates) • Phase III to proceed in three steps: • Focus on Denver-Julesburg Basin in support of Colorado ozone SIP modeling as a pilot study • Expand to include other major basins covered by IPAMS members • Develop an annual reporting tool to facilitate future reporting