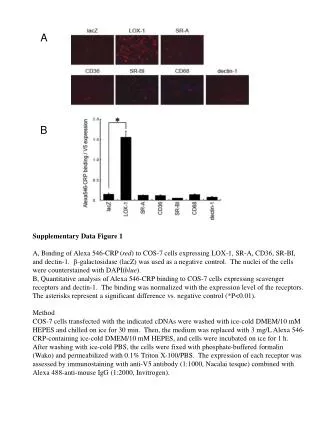
Download
1 / 1
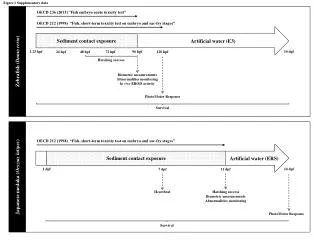
10 likes | 96 Views
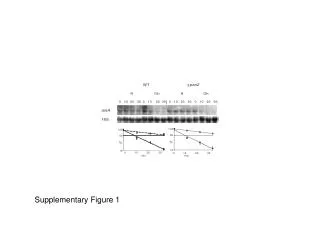
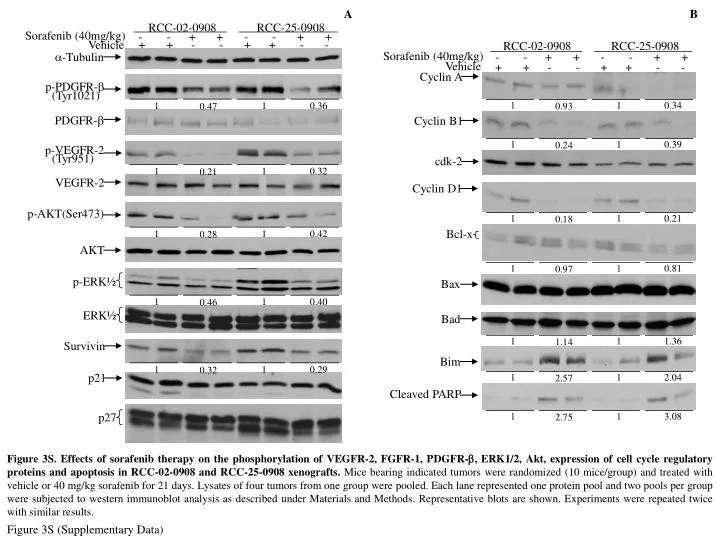
1. 1. 1. 1. 1. 1. 1. 1. 1. 1. 1. 1. 1. 1. 1. 1. 1. 1. 1. 1. 1. 1. 1. 1. 0.81. 0.32. 3.08. 0.39. 2.04. 1.36. 0.29. 0.36. 0.34. 0.40. 0.42. 0.21. 1.14. 0.32. 2.75. 2.57. 0.21. 0.47. 0.28. 0.46. 0.93. 0.24. 0.97. 0.18. A. B. RCC-02-0908. RCC-25-0908.

E N D
1 1 1 1 1 1 1 1 1 1 1 1 1 1 1 1 1 1 1 1 1 1 1 1 0.81 0.32 3.08 0.39 2.04 1.36 0.29 0.36 0.34 0.40 0.42 0.21 1.14 0.32 2.75 2.57 0.21 0.47 0.28 0.46 0.93 0.24 0.97 0.18 A B RCC-02-0908 RCC-25-0908 Sorafenib (40mg/kg) - - + + - - + + + + - - + + - - Vehicle RCC-02-0908 RCC-25-0908 -Tubulin Cyclin A Sorafenib (40mg/kg) - - + + - - + + Vehicle + + - - + + - - p-PDGFR- (Tyr1021) Cyclin B1 PDGFR- cdk-2 p-VEGFR-2 (Tyr951) Cyclin D1 VEGFR-2 Bcl-x p-AKT(Ser473) AKT Bax p-ERK½ Bad ERK½ Bim Survivin Cleaved PARP p21 p27 Figure 3S. Effects of sorafenib therapy on the phosphorylation of VEGFR-2, FGFR-1, PDGFR-, ERK1/2, Akt, expression of cell cycle regulatory proteins and apoptosis in RCC-02-0908 and RCC-25-0908 xenografts. Mice bearing indicated tumors were randomized (10 mice/group) and treated with vehicle or 40 mg/kg sorafenib for 21 days. Lysates of four tumors from one group were pooled. Each lane represented one protein pool and two pools per group were subjected to western immunoblot analysis as described under Materials and Methods. Representative blots are shown. Experiments were repeated twice with similar results. Figure 3S (Supplementary Data)