Download
1 / 1
10 likes | 84 Views
A. B. C. G1 – 38.97%. Non- synchronized cells. S – 23.93%. Cell count. G2/M – 17.52%. cRTC DNA. Early DNA-containing nRTCs. Late DNA-containing nRTCs. nRTC DNA. 100. 100. G1 – 52.79%. 63.32 ±11.2. Thymidine- synchronized cells before infection. 80. 80. S – 38.12%.

E N D
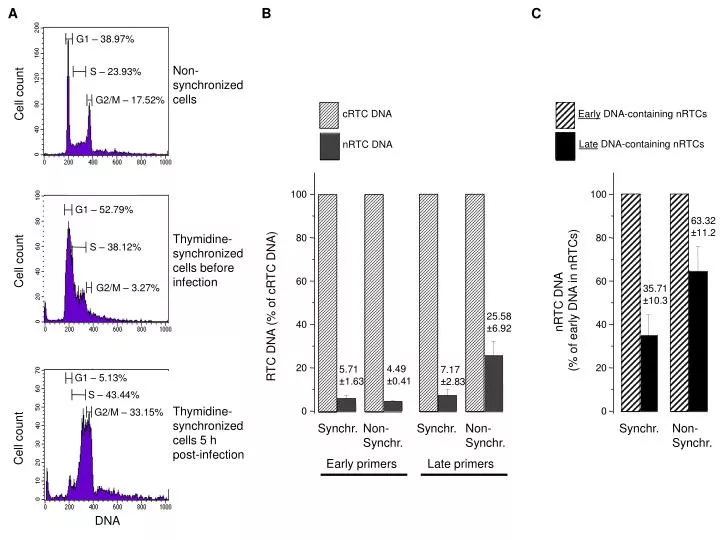
A B C G1 – 38.97% Non- synchronized cells S – 23.93% Cell count G2/M – 17.52% cRTC DNA Early DNA-containing nRTCs Late DNA-containing nRTCs nRTC DNA 100 100 G1 – 52.79% 63.32 ±11.2 Thymidine- synchronized cells before infection 80 80 S – 38.12% Cell count 60 60 G2/M – 3.27% 35.71 ±10.3 nRTC DNA (% of early DNA in nRTCs) RTC DNA (% of cRTC DNA) 25.58 ±6.92 40 40 4.49 ±0.41 5.71 ±1.63 7.17 ±2.83 20 20 G1 – 5.13% S – 43.44% Thymidine- synchronized cells 5 h post-infection G2/M – 33.15% 0 0 Synchr. Non- Synchr. Synchr. Non- Synchr. Synchr. Non- Synchr. Cell count Early primers Late primers DNA