Download
1 / 22
220 likes | 307 Views
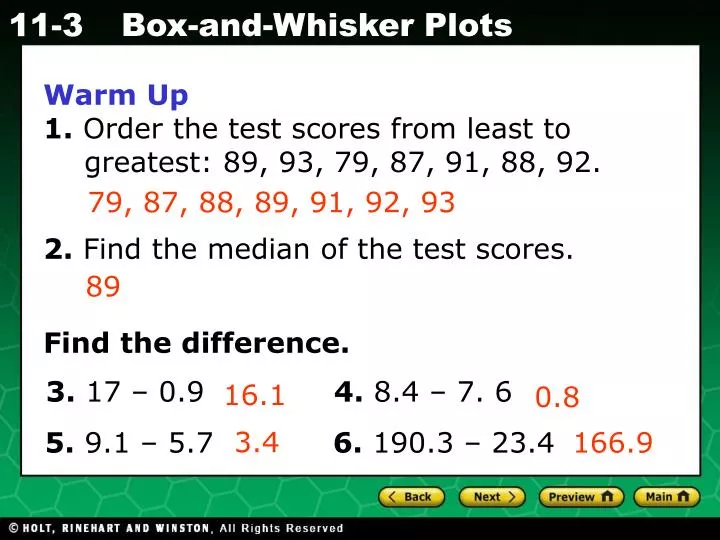
Warm Up 1. Order the test scores from least to greatest: 89, 93, 79, 87, 91, 88, 92. 2. Find the median of the test scores. Find the difference. 79, 87, 88, 89, 91, 92, 93. 89. 3. 17 – 0.9 4. 8.4 – 7. 6. 16.1. 0.8. 3.4. 166.9. 5. 9.1 – 5.7 6. 190.3 – 23.4.

E N D
Warm Up 1. Order the test scores from least to greatest: 89, 93, 79, 87, 91, 88, 92. 2. Find the median of the test scores. Find the difference. 79, 87, 88, 89, 91, 92, 93 89 3. 17 – 0.9 4. 8.4 – 7. 6 16.1 0.8 3.4 166.9 5. 9.1 – 5.7 6. 190.3 – 23.4
Common Core State Standards Learning Objective 7.SP.3 Compare two numerical data distributions.
Vocabulary lower quartile upper quartile box-and-whisker plot minimum maximum
The table below summarizes a cat breeder’s records for kitten litters born in a given year. You can divide the data into four equal part using quartiles.
Upper quartile: 5 median of upper half Lower quartile: 3 median of lower half Median: 4 You know that the median of a data set divides the data into a lower half and an upper half. The median of the lower half is the lower quartile, and the median of the upper half is the upper quartile. Kitten Data Lower half Upper half 2 3 3 3 3 3 3 4 4 4 4 4 4 4 4 5 5 5 5 5 5 5 5 5 5 5 6
Additional Example 1: Finding Quartiles Find the lower and upper quartiles for the data set. A. 15, 83, 75, 12, 19, 74, 21 Order the values. 12 15 19 21 74 75 83 lower quartile: 15 upper quartile: 75
63 + 75 2 lower quartile: = 69 79 + 88 2 upper quartile: = 83.5 Additional Example 1: Finding Quartiles Find the lower and upper quartiles for the data set. B. 75, 61, 88, 79, 79, 99, 63, 77 Order the values. 61 63 75 77 79 79 88 99
Check It Out! Example 1 Find the lower and upper quartiles for the data set. A. 25, 38, 66, 19, 91, 47, 13 Order the values. 13 19 25 38 47 66 91 lower quartile: 19 upper quartile: 66
33 + 45 2 lower quartile: = 39 49 + 59 2 upper quartile: = 54 Check It Out! Example 1 Find the lower and upper quartiles for the data set. B. 45, 31, 59, 49, 49, 69, 33, 47 Order the values. 31 33 45 47 49 49 59 69
1 2 3 4 5 6 7 8 9 A box-and-whiskerplot shows the distribution of data. The middle half of the data is represented by a “box” with a vertical line at the median. The lower fourth and upper fourth quarters are represented by “whiskers” that extend to the minimum (least) and maximum (greatest) values. Lower quartile Upper quartile Median
15 + 17 2 21 + 21 2 upper quartile: = 21 lower quartile: = 16 19 + 19 2 median: = 19 Additional Example 2: Making a Box-and-Whisker Plot Use the given data to make a box-and-whisker plot. 21, 25, 15, 13, 17, 19, 19, 21 Step 1. Order the data from least to greatest. Then find the minimum, lower quartile, median, upper quartile, and maximum. 13 15 17 19 19 21 21 25 minimum: 13 maximum: 25
12 14 16 18 20 22 24 26 28 Additional Example 2 Continued Use the given data to make a box-and-whisker plot. Step 2. Draw a number line and plot a point above each value from Step 1. 13 15 17 19 19 21 21 25
12 14 16 18 20 22 24 26 28 Additional Example 2 Continued Use the given data to make a box-and-whisker plot. Step 3. Draw the box and whiskers. 13 15 17 19 19 21 21 25
31 + 33 2 24 + 26 2 upper quartile: = 32 lower quartile: = 25 29 + 31 2 median: = 30 Check It Out! Example 2 Use the given data to make a box-and-whisker plot. 31, 23, 33, 35, 26, 24, 31, 29 Step 1. Order the data from least to greatest. Then find the minimum, lower quartile, median, upper quartile, and maximum. 23 24 26 29 31 31 33 35 minimum: 23 maximum: 35
22 24 26 28 30 32 34 36 38 Check It Out! Example 2 Continued Use the given data to make a box-and-whisker plot. Step 2. Draw a number line and plot a point above each value. 23 24 26 29 31 31 33 35
22 24 26 28 30 32 34 36 38 Check It Out! Example 2 Continued Use the given data to make a box-and-whisker plot. Step 3. Draw the box and whiskers. Step 2. Draw a number line and plot a point above each value. 23 24 26 29 31 31 33 35
Oakland 0 3 6 9 12 15 18 Tampa Bay 0 3 6 9 12 15 18 Check It Out! Example 3 These box-and-whisker plots compare the points per quarter at Super Bowl XXXVII.
Oakland 0 3 6 9 12 15 18 Tampa Bay 0 3 6 9 12 15 18 Check It Out! Example 3A A. Compare the medians. The median for Tampa Bay is significantly greater than Oakland’s.
Lesson Quiz: Part I Find the lower and upper quartiles for each data set. 1. 48, 52, 68, 32, 53, 47, 51 2. 3, 18, 11, 2, 7, 5, 9, 6, 13, 1, 17, 8, 0 lower = 47; upper = 53 lower = 2.5; upper = 12
78 87 91 94 98 Lesson Quiz: Part II Use the following data for problems 3 and 4. 91, 87, 98, 93, 89, 78, 94 3. Make a box-and-whisker plot. 4. What is the median of the data? 91
Checking for Understanding Box and Whisker Plots
Classwork & Homework Lesson 11-3 Practice B Lesson 11-3 Problem Solving