Download

1 / 33
330 likes | 490 Views
Segmentation and greedy algorithms. Prof. Noah Snavely CS1114 http :// www.cs.cornell.edu/courses/cs1114. Administrivia. A5P1 due tomorrow (demo slots available) A5P2 out this weekend, due 4/19 Prelim 2 on Tuesday Quizzes available Monday Midterm course evaluations. SIFT Matching Demo.

E N D
Segmentation and greedy algorithms Prof. Noah Snavely CS1114 http://www.cs.cornell.edu/courses/cs1114
Administrivia • A5P1 due tomorrow (demo slots available) • A5P2 out this weekend, due 4/19 • Prelim 2 on Tuesday • Quizzes available Monday • Midterm course evaluations
Last time: k-means Legend - centers (means) - clusters
k-means • Idea: find the centers that minimize the sum of squared distances to the points • Objective:
A greedy method for k-means • Unfortunately, this doesn’t work that well • The answer we get could be much worse than the optimum • However, if we change our objective (e.g., k-centers, then we get an answer within 2 times the cost of the best answer
Back to k-means • There’s a simple iterative algorithm for k-means • Lloyd’s algorithm • Start with an initial set of means • For instance, choose k points at random from the input set • Assign each point to the closest mean • Compute the means of each cluster • Repeat 2 and 3 until nothing changes
Lloyd’s algorithm Demo
Lloyd’s algorithm • Does it always terminate? • Yes, it will always converge to some solution • Might be a local minima of the objective function • Error decreases after every iteration • Error could be arbitrarily bad
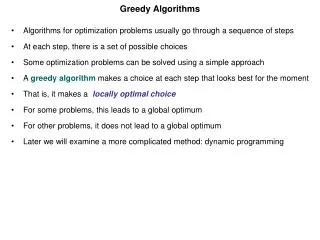
Possible algorithms • Greedy algorithms • Do what seems best at any given point • Example: making change • Iterative algorithms • Start with some answer, take a small step to improve it, repeat until it doesn’t get better • Examples: Lloyd’s algorithm for k-means, bubble sort, hill climbing
Where we are so far • Greedy algorithms and iterative algorithms sometimes give the right answer (e.g., making change with U.S. currency) • Some clustering objective functions are easier to optimize than others: • k-means very hard • k-centers very hard, but we can use a greedy algorithm to get within a factor of two of the best answer
Back to graphs • We can also associate a weight with each edge (e.g., the distance between cities) 200 100 200 150 400 100 300 250 400 100 150 250 London Frankfurt Paris Hamburg Vienna Prague Berlin Rome Warsaw Naples
Spanning trees • A spanning tree of a graph is a subgraph that (a) connects all the vertices and (b) is a tree 100 200 200 200 100 200 200 150 150 400 400 400 100 100 300 300 250 250 250 400 400 100 100 100 150 150 150 250 250 250 London London London Frankfurt Frankfurt Frankfurt Paris Paris Paris Hamburg Hamburg Hamburg Vienna Vienna Vienna Prague Prague Prague Berlin Berlin Berlin Rome Rome Rome Q: How many edges are there in a spanning tree on n vertices? Warsaw Warsaw Warsaw Naples Naples Naples Spanning trees
Graph costs • We’ll say the cost of a graph is the sum of its edge weights 100 200 200 200 150 400 400 100 300 250 250 400 100 100 150 150 250 250 London London Frankfurt Frankfurt Paris Paris Hamburg Hamburg Cost = 200 + 200 + 100 + 400 + 300 + 100 + 250 + 150 + 250 = 1950 Cost = 200 + 400 + 100 + 400 + 150 + 250 + 100 + 150 + 250 = 2000 Vienna Vienna Prague Prague Berlin Berlin Rome Rome Warsaw Warsaw Naples Naples
Minimum spanning trees • We define the minimum spanning tree (MST) of a graph as the spanning tree with minimum cost • (Suppose we want to build the minimum length of track possible while still connecting all the cities.) 200 200 100 100 200 200 150 400 100 100 300 250 250 400 400 100 100 150 150 250 250 London London Frankfurt Frankfurt Paris Paris Hamburg Hamburg Vienna Vienna Prague Prague Berlin Berlin Rome Rome Warsaw Warsaw Naples Naples MST: Cost = 1750 (Eurorail needs to build 1750 mi of track at minimum)
Minimum spanning trees • This is an optimization problem where the objective function is the cost of the tree • Can you think of a greedy algorithm to do this? 200 100 200 150 400 100 300 250 400 100 150 250 London London Frankfurt Frankfurt Paris Paris Hamburg Hamburg Vienna Vienna Prague Prague Berlin Berlin Rome Rome Warsaw Warsaw Naples Naples
Minimum spanning tree • Greedy algorithm: 200 100 200 London 150 400 Frankfurt 100 300 Paris 200 100 250 Hamburg 200 400 100 100 150 Vienna 250 Prague 400 250 Berlin London Rome 100 150 Frankfurt Paris 250 Warsaw Hamburg Naples Vienna Prague Berlin Rome Warsaw Naples
Minimum spanning tree • This greedy algorithm is called Kruskal’s algorithm • Not that simple to prove that it gives the MST • How many connected components are there after adding the kth edge? 200 100 200 London 150 400 Frankfurt 100 300 Paris 200 100 250 Hamburg 200 400 100 100 150 Vienna 250 Prague 400 250 Berlin London Rome 100 150 Frankfurt Paris 250 Warsaw Hamburg Naples Vienna Prague Berlin Rome Warsaw Naples
Kruskal’s algorithm • Start with an empty graph • Sort edges by weight, in increasing order • Go through each edge in order • If adding edge creates a cycle, skip it • Otherwise, add the edge to the graph
Back to clustering • We can define the clustering problem on graphs 9 4 8 4 12 10 7 11 5 8
Clustering using graphs • Clustering breaking apart the graph by cutting long edges • Which edges do we break? 9 4 8 4 12 10 7 11 5 8
Spacing as a clustering metric • Another objective function for clustering: • Maximize the minimum distance between clusters • (Called the spacing.) spacing
Cool fact • We compute the clusters with the maximum spacing during MST! • To compute the best k clusters, just stop MST construction k-1 edges early 200 100 200 London 150 400 Frankfurt 100 300 Paris 200 100 250 Hamburg 200 400 100 100 150 Vienna 250 Prague 250 Berlin London Rome 100 150 Frankfurt Paris 250 Warsaw Hamburg Naples 400 Vienna Prague Berlin Rome Warsaw Naples 2 clusters with max spacing (=400)
Proof of cool fact • Suppose this wasn’t true – then someone could give us a different clustering with a bigger spacing • Let C be our MST clustering, and let D be the purportedly better one • There must be two nodes u and v in different clusters in D but in the same cluster in C • There’s a path between u and v in C, and at some point this path crosses a cluster boundary in D
Pictorial proof D London Frankfurt Paris Hamburg 200 100 200 100 Vienna 250 Prague 400 Berlin 150 100 Rome 250 Warsaw Naples
Demo • http://www.kovan.ceng.metu.edu.tr/~maya/kmeans/index.html
Where we are so far • Greedy algorithms work sometimes (e.g., with MST) • Some clustering objective functions are easier to optimize than others: • k-means very hard • k-centers very hard, but we can use a greedy algorithm to get within a factor of two of the best answer • maximum spacing very easy! Just do MST and stop early (this gives exact answer)