Download
1 / 31
310 likes | 663 Views
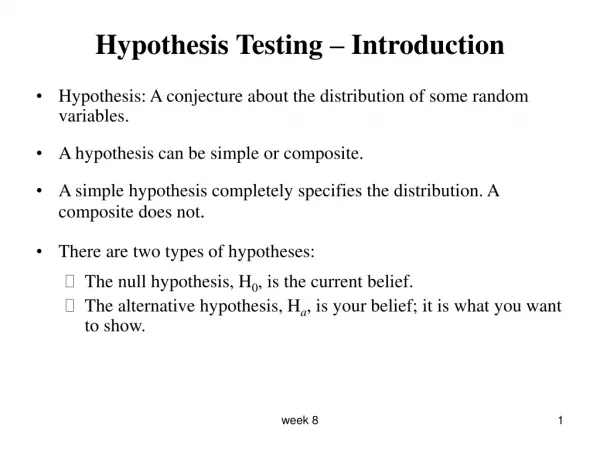
Introduction to Hypothesis Testing. CJ 526 Statistical Analysis in Criminal Justice. Hypotheses. A hypothesis is a prediction about the outcome of a research study. Hypothesis Testing.

E N D
Introduction to Hypothesis Testing CJ 526 Statistical Analysis in Criminal Justice
Hypotheses A hypothesis is a prediction about the outcome of a research study
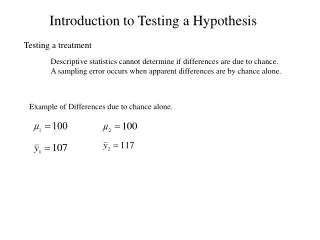
Hypothesis Testing Hypothesis testing is an inferential procedure that uses sample data to evaluate the credibility of a hypothesis about a population
Overview of Hypothesis Testing • State a hypothesis about a population • Usually in terms of the value of a population parameter • Typically the mean or the difference between means
Overview of Hypothesis Testing -- Continued If the data are consistent with the hypothesis, conclude that the hypothesis was reasonable, and fail to reject it
Example • Babies birth weight will not differ between smoking and non-smoking mothers (null) • Babies born to women who smoke during pregnancy will be more likely to be of low birth weight (alternative) • Independent Variable: • Smoking during pregnancy • Dependent Variable: • Birth weight
Example -- Continued • Obtain a random sample of women who are pregnant and smoke • Obtain a random sample of non-smoking pregnant women, or compare to the national average • Weigh the babies at birth • Compare sample data to hypothesis • Make decision: • Reject the null hypothesis • Fail to reject the hypothesis
Assumptions Behind Hypothesis Testing The effect of the Independent Variable (treatment effect) is assumed to: Add (or subtract) a constant from every individual’s score
The Logic of Hypothesis Testing • Can’t prove hypothesis • Proof requires evidence for all cases
Steps in Hypothesis Testing • Determine the number of samples (groups, conditions) • One • Two • k (three or more)
Steps in Hypothesis Testing -- continued • If there are two or more samples, determine whether they are independent or dependent • Same group (repeated-measures) • Match on some other variable(s) known to influence DV (matched-subjects)
Steps in Hypothesis Testing -- continued • If there is one sample and the Dependent Variable is at the Interval or Ratio Level of Measurement, is the standard deviation of the population (, sigma) known: • If is known, use a One-Sample z-Test • If is unknown, use a One-Sample t-Test
Steps in Hypothesis Testing -- continued • Identify the independent variable • Identify the dependent variable and its level of measurement • Identify the population to which inferences will be made
Steps in Hypothesis Testing -- continued • Determine the appropriate inferential statistical test • Number of samples • Nature of samples (if applicable) • Level of measurement of DV • State the null hypothesis • State the alternative hypothesis
Steps in Hypothesis Testing -- continued • State Decision Rule: • If the p-value of the obtained test statistic is less than .05, reject the Null Hypothesis • Use SPSS to compute the obtained test statistic • Make decision • Interpret results
Null Hypothesis The null hypothesis predicts that the Independent Variable (treatment) will have no effect on the Dependent Variable for the population
Alternative Hypothesis The alternative hypothesis predicts that the Independent Variable (treatment) will have an effect on the Dependent Variable for the population
Directional Alternative Hypotheses Researcher has reason to believe before conducting the test that a difference will lie in a specified direction • Prior research • Theory
Non-directional Alternative Hypotheses Researcher has no reason to believe that there will be a difference in a specified direction There is insufficient research or information or theory to make a specific prediction
Set the Criteria Because of sampling error, there is likely to be a discrepancy between the sample mean and the population mean At what point does the difference become meaningful and not just a matter of chance?
3. Collect Sample Data Use the data to calculate the obtained test statistic, using the appropriate statistical test, based on level of measurement of the dependent variable, number of samples, whether the samples are independent or related
4. Evaluate the Null Hypothesis • Reject the null hypothesis • If sample data is unlikely to have been drawn from a population where the null hypothesis is true • If the p-value of the obtained test statistic is less than .05, meaning that the null hypothesis is rejected and there is less than a 5% probability that this decision is incorrect • The alternative is accepted, that there is a difference OR
Failure to Reject the Null Hypothesis • Either: • Treatment had an effect, could not demonstrate it • or • Treatment had no effect
Type I Error Committed when H0 is rejected as false although it is true Type II Error Committed when H0 is not rejected although it is false
Statistical Power Probability that the test will correctly reject a false null hypothesis
Power -- Continued When a treatment effect exists • A study may fail to discover it (Type II error, fail to reject a false null hypothesis) • A study may discover it (reject a false null hypothesis)
Power -- Continued Reducing alpha (.05 --> .01 --> .001) • Reduces power • Inverse relationship between Type I and Type II errors
Power -- Continued Some inferential statistical tests are more powerful
Level of Significance Alpha: probability of committing a Type I error • Reject H0 although it is true • Symbolized by