Download
1 / 17
180 likes | 325 Views
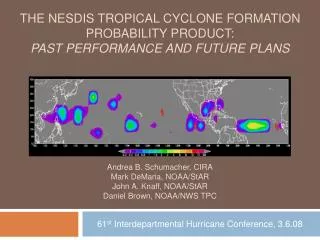
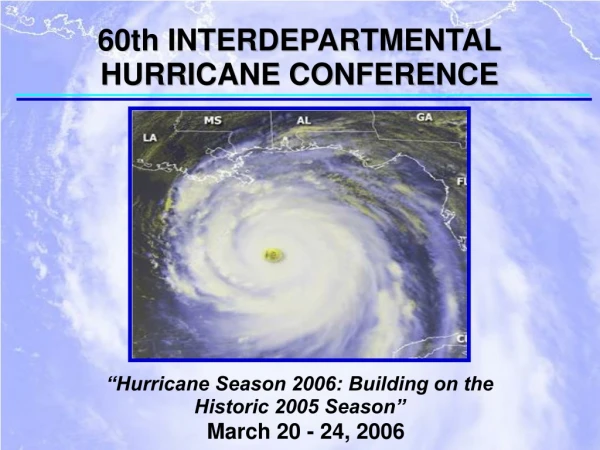
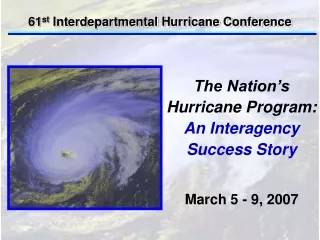
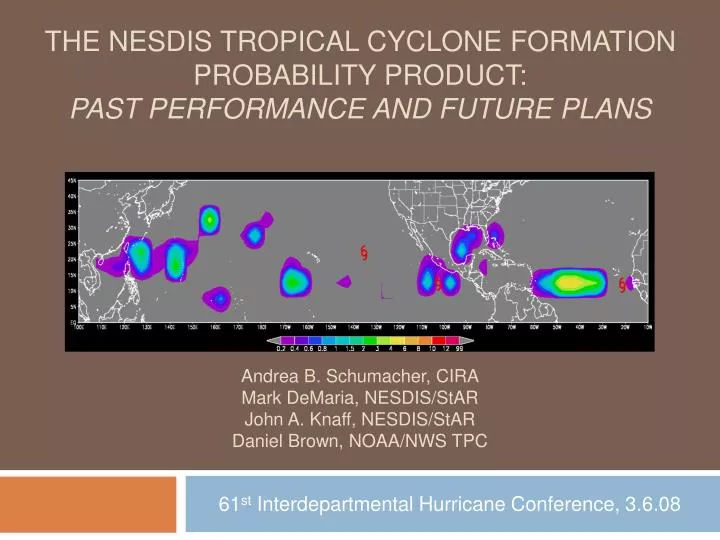
THE NESDIS TROPICAL CYCLONE FORMATION PROBABILITY PRODUCT: PAST PERFORMANCE AND FUTURE PLANS Andrea B. Schumacher, CIRA Mark DeMaria, NESDIS/StAR John A. Knaff, NESDIS/StAR Daniel Brown, NOAA/NWS TPC. 61 st Interdepartmental Hurricane Conference, 3.6.08. Motivation.

E N D
THE NESDIS TROPICAL CYCLONE FORMATION PROBABILITY PRODUCT:PAST PERFORMANCE AND FUTURE PLANSAndrea B. Schumacher, CIRAMark DeMaria, NESDIS/StARJohn A. Knaff, NESDIS/StARDaniel Brown, NOAA/NWS TPC 61st Interdepartmental Hurricane Conference, 3.6.08
Motivation • Need for objective, real-time TC formation guidance • NHC needs objective guidance to help make Tropical Cyclone formation forecasts • Numerical models provide objective guidance • As resolution improves, forecast models gets better at handling TC formation • However, still bias towards over-prediction (Beven 1999)
Approach • Compute 24-hour probability of TC formation over all 5º x 5º lat/lon grid boxes in domain by analyzing environmental & convective conditions
Approach “A Needle in a Haystack” Ratio of TC formation to non-formation points ~ 1:2000 Maximum climatological formation probability ~1.8% (E. Pacific) Compute 24-hour probability of TC formation over all 5º x 5º lat/lon grid boxes in domain by analyzing environmental & convective conditions
Datasets • NHC/DOD Best Tracks 1949-2005 • Atlantic, E. Pacific, Central Pacific & W. Pacific • Subtropical/Extratropical cases excluded • Unnamed depressions included since 1989 • NCEP Global Model Analyses 1995-2005 • Reanalysis 1995-1999 (2.5o grid) • Operational Analyses 2000-2005 (1.0o grid) • Geostationary Satellite Water Vapor Imagery (16 km Re-mapped Mercator projection) • GOES-E 1995-2005 • GOES-W 1998-2005 • GMS-5 / GOES-9 / MTSAT-1R 2000-2005
Screening Step: Remove all points where TC formation is highly unlikely < 5% TCG points removed 75-80% non-TCG points removed Product Algorithm
Product Algorithm • Linear Discriminant Analysis Step: • Uses developmental dataset parameter values • Solves for coefficients a0,..,an so that the distance between parameter means for each group (TCG and non-TCG) are maximized in standard deviation units • For each independent data point with parameter values x1,…,xn, the LDF determines group membership, where LDF = a0 + a1x1 + … + anxn • Deterministic (yes/no) *Perrone & Lowe (1986), Hennon & Hobgood (2003), Knaff et al. (2008)
Product Algorithm • Probability Determination Step: • Use dependent dataset to develop a relationship between LDF and TC formation probability • Coefficients and LDF/probability relationship defines the TCFP product
Recent Product Updates • Added 2004 & 2005 to dependent dataset • Expanded to cover Central and Western N. Pacific basins • Uses GOES-E, GOES-W and MTSAT-1R water vapor imagery, divides domain into 3 basins (below) • Added HDIV (850 hPa horiz. divergence) parameter • Scheduled to replace operational product by Summer 2008
Reliability Diagrams • Both dependent years (orange) and independent years (green) show good agreement between predicted and observed TC formation probabilities • E. Pacific basin diagram suggests the actual TC formation probability may be greater than what the TCFP product predicts at higher probabilities – may need correction
Verification – Relative Operating Characteristic and Brier Scores • Typical metrics are not valid for such rare events. However, we can use metrics that compare TCFP product to climatology • Brier Skill Score: BSS = 1 - BS/BSref • ROC Skill Score: RSS = ROC/ROCref - 1 • Brier Score, BS = 1/N Σ i=1,n (pi-oi)2, where pi and oi are the predicted and observed probability for case i, respectively • ROC is the area under the plot of hit rate vs. false alarm rate for various probability thesholds.
Skill Scores & Interpretation • BSS positive, but small • RSS for E. Pacific much smaller than others hard to beat climatology in that basin
The current TCFP has run operationally since 2004 and has shown skill with respect to climatology (not shown) The TCFP has been successfully updated and extended to cover the Central and Western N. Pacific 2007 verification of the updated TCFP demonstrates it has skill above climatology alone in all 3 basins Extended TCFP product to be implemented operationally by summer 2008 Summary
Future Plans & Improvements • Expand domain to include S. Hemisphere & Indian Ocean • Extend forecast period from 24 h to 48 h + • Use GFS forecast fields • Analyze global water vapor strip to identify upstream predictors, particularly convective signatures associated with tropical waves (Frank and Roundy 2006) • Identify new parameters to add to algorithm • TAFB invest locations and intensities (D. Brown)