Download
1 / 37
380 likes | 415 Views
Epistasis / Multi-locus Modelling. Shaun Purcell, Pak Sham SGDP, IoP, London, UK. Multipoint (more markers). QTL. M. M. M. M. M. M. M. M. QTL. QTL. QTL. QTL. QTL. QTL. QTL. QTL. M. I. I. T. T. T. T. T. T. T. T. T. Multivariate (more traits).

E N D
Epistasis / Multi-locus Modelling Shaun Purcell, Pak Sham SGDP, IoP, London, UK
Multipoint (more markers) QTL M M M M M M M M QTL QTL QTL QTL QTL QTL QTL QTL M I I T T T T T T T T T Multivariate (more traits) Multiplex (larger families) Multilocus (modelling more QTLs) I
E1 E2 E3 QTL2 QTL3 QTL4 E4 QTL5 Single locus model QTL1 T
E1 E2 E3 QTL3 QTL4 E4 QTL5 Multilocus model QTL1 QTL2 T
GENE x GENE Interaction • GENE x GENE INTERACTION : Epistasis • Additive genetic effects : • alleles at a locus and across loci independently sum to result in a net phenotypic effect • Nonadditive genetic effects : • effects of an allele modified by the presence of other alleles (either at the same locus or at different loci)
Nonadditive genetic effects • Dominance • an allele allele interaction occurring within one locus • Epistasis • an interaction occurring between the alleles at two (or more) different loci • Additionally, nonadditivity may arise if the effect of an allele is modified by the presence of certain environments
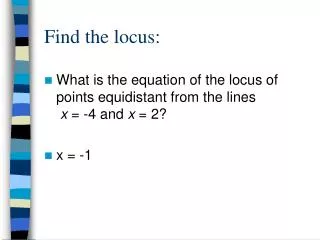
Separate analysis • locus A shows an association with the trait • locus B appears unrelated Locus B Locus A
Joint analysis • locus B modifies the effects of locus A
Genotypic Means • Locus A • Locus BAA Aa aa • BBAABBAaBBaaBBBB • BbAABbAaBbaaBbBb • bbAabbAabbaabbbb • AAAaaa
Partitioning of effects • Locus A • Locus B M P M P
4 main effects M Additive effects P M P
6 twoway interactions M P Dominance M P
6 twoway interactions M M P P Additive-additive epistasis M P M P
4 threeway interactions M P M Additive-dominance epistasis P P M M P M M P P
1 fourway interaction Dominance-dominance epistasis M P M P
One locus • Genotypic • means • AA m + a • Aa m + d • aa m - a 0 -a +a d
m m m – aA + aA – aa + aB + aB + da + dA + aa + aB m m m + aA – aA + dB + ad + dA + dB + dB – ad m m m – aA – aB – aa – da – aB – aB + aA + dA + aa Two loci • AA Aa aa • BB • Bb • bb + dd
Research questions • How can epistasis be modelled under a variance components framework? • How powerful is QTL linkage to detect epistasis? • How does the presence of epistasis impact QTL detection when epistasis is not modelled?
Variance components • QTL linkage : single locus model • P = A + D + S + N • Var (P) = 2A + 2D + 2S + 2N • Under H1 : • Cov(P1,P2) = 2A +z2D + 2S • where = proportion of alleles shared identical-by- • descent (ibd) between siblings at that locus • z = probability of complete allele sharing ibd • between siblings at that locus • Under H0 : • Cov(P1,P2) = ½2A +¼2D + 2S • where ½ = proportion of alleles shared identical-by- • descent (ibd) between siblings • ¼= prior probability of complete allele sharing ibd between siblings
Covariance matrix • Sib 1 Sib 2 • Sib 1 2A + 2D + 2S + 2N2A + z2D+ 2S • Sib 2 2A + z2D+ 2S2A + 2D + 2S + 2N Sib 1 Sib 2 Sib 1 2A + 2D + 2S + 2N½2A + ¼2D+ 2S Sib 2 ½2A + ¼2D+ 2S2A + 2D + 2S + 2N
QTL linkage : two locus model • P = A1 + D1 + A2 + D2 • + A1A1 + A1D2 + D1A2 + D1D2 • + S + N • Var (P) = 2A + 2D + 2A + 2D • + 2AA + 2AD + 2DA + 2DD • + 2S + 2N
Under linkage : • Cov(P1,P2) = 2A + z2D + 2A + z2D • + 2A + z2AD + z2DA + zz2DD • + 2S • Under null : • Cov(P1,P2) = ½2A + ¼2D + ½2A + ¼2D • + E()2A+E(z)2AD +E(z)2DA+ E(zz)2DD • + 2S
IBD locus 12 Expected Sib Correlation 002S 012A/2 + 2S 022A + 2D + 2S 102A/2 + 2S 112A/2 + 2A/2 + 2AA/4 + 2S 122A/2 + 2A + 2D + 2AA/2 + 2AD/2 + 2S 202A + 2D + 2S 212A + 2D + 2A/2 + 2AA/2 + 2DA/2 + 2S 222A + 2D + 2A + 2D+ 2AA + 2AD + 2DA + 2DD + 2S
Joint IBD sharing for two loci • For unlinked loci, • Locus A • 0 1 2 • Locus B 0 1/16 1/8 1/16 1/4 • 1 1/8 1/4 1/8 1/2 • 2 1/16 1/8 1/16 1/4 • 1/4 1/2 1/4
Joint IBD sharing for two linked loci at QTL 1 at QTL 2 0 1/2 1 0 1/2 1
Potential importance of epistasis • “… a gene’s effect might only be detected within a framework that accommodates epistasis…” • Locus A • A1A1 A1A2 A2A2 Marginal Freq. 0.25 0.50 0.25 • B1B1 0.25 0 0 1 0.25 • Locus B B1B2 0.50 0 0.5 0 0.25 • B2B2 0.25 1 0 0 0.25 • Marginal 0.25 0.25 0.25
Power calculations for epistasis Specify genotypic means, allele frequencies residual variance • Calculate under full model and submodels variance components expected non-centrality parameter (NCP)
Submodels Apparent variance components - biased estimate of variance component - i.e. if we assumed a certain model (i.e. no epistasis) which, in reality, is different from the true model (i.e. epistasis) Enables us to explore the effect of misspecifying the model
Detecting epistasis The test for epistasis is based on the difference in fit between • - a model with single locus effects and epistatic effects and • - a model with only single locus effects, Enables us to investigate the power of the variance components method to detect epistasis
True Model Assumed Model A B A a a* b Y Y a* is the apparent co-efficient a* will deviate from a to the extent that A and B are correlated
Full VA1 VD1VA2 VD2VAA VAD VDA VDD VS and VN estimated in all models - DD V*A1 V*D1V*A2 V*D2V*AA V*AD V*DA - - AD V*A1 V*D1V*A2 V*D2V*AA - - - - AA V*A1 V*D1V*A2 V*D2 - - - - - D V*A1 - V*A2 - - - - - - A V*A1 - - - - - - - H0 - - - - - - - -
Example 1 : epi1.mx • Genotypic Means B1B1 B1B2 B2B2 • A1A1 0 0 1 • A1A2 0 0.5 0 • A2A2 1 0 0 • Allele frequencies A1 = 50% ; B1 = 50% • QTL variance 20% • Shared residual variance 40% • Nonshared residual variance 40% • Sample N 10, 000 unselected pairs • Recombination fraction Unlinked (0.5)
Example 2 : epi2.mx • Genotypic Means B1B1 B1B2 B2B2 • A1A1 0 1 2 • A1A2 0 1 2 • A2A2 2 1 0 • Allele frequencies A1 = 90% ; B1 = 50% • QTL variance 10% • Shared residual variance 20% • Nonshared residual variance 70% • Sample N 2, 000 unselected pairs • Recombination fraction 0.1
Exercise • Using the module, are there any configurations of means, allele frequencies and recombination fraction that result in only epistatic components of variance? • How does linkage between two epistatically interacting loci impact on multilocus analysis?
Poor power to detect epistasis • Detection = reduction in model fit when a term is dropped • Apparent variance components “soak up” variance attributable to the dropped term • artificially reduces the size of the reduction
Epistasis as main effect • Epistatic effects detected as additive effects • “Main effect” versus “interaction effect” blurred • for linkage, main effects and interaction effects are partially confounded
Probability Function Calculator • http://statgen.iop.kcl.ac.uk/bgim/ • Genetic Power Calculator • http://statgen.iop.kcl.ac.uk/gpc/