Download

1 / 24
240 likes | 247 Views
FY16-17 PGA 582-16-61361-01 Task 2.1. Review of Northeast Texas. 2016 Ozone Season.

E N D
FY16-17 PGA 582-16-61361-01 Task 2.1 Review of Northeast Texas 2016 Ozone Season • Presentation to the NETAC Policy and Technical Committees • May 3, 2017 • Lynsey Parker, Thomas Pavlovic, Sue Kemball-Cook and Greg Yarwood
Today’s Presentation • Update on ozone Design Values and trends • Implications for attainment • Review of 2016 ozone season
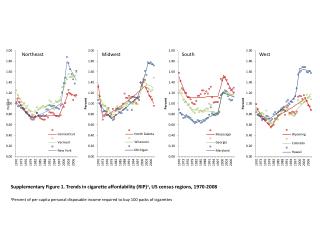
Ozone Trends: Northeast Texas Design Values • 2016 had the lowest Design Values ever recorded for all three monitors • Design Values for all three monitors are lower than the 70 ppb 2015 NAAQS NAAQS 1997: 84 ppb 2008: 75 ppb 2015: 70 ppb
2015 Ozone Standard: Attainment Status of Northeast Texas • In September, 2016, the State of Texas recommended to EPA that all NETAC counties be designated attainment (Smith, Gregg, Harrison) or unclassifiable/attainment (Rusk, Upshur) based on 2013-2015 data • EPA will use 2014-2016 data in attainment designations under the 2015 ozone NAAQS • All Northeast Texas monitor 2014 – 2016 Design Values attain the EPA’s 2015 ozone NAAQS of 70 ppb
4thHigh MDA8 Ozone Needed to Attainthe70 ppb NAAQS in 2017 • Since 2008, Longview C19 has had 1 year (2011) with 4th high MDA8 >79 ppb • Most recent year when Tyler C82 MDA8 > 83 ppb was 2005 • Karnack C85 has never exceeded 91 ppb
4 Highest MDA8 Ozone Concentrations at Northeast Texas Monitors in 2016 • Only one day with MDA8 > 70 ppb at any monitor • June 30, 2016 MDA8: Tyler C82: 71 ppb, Longview C19: 70 ppb • Missing data at Karnack • High ozone day analysis performed for June 30, 2016
East Texas MDA8 Ozone on June 30, 2016 • MDA8 > 70 ppb only at Tyler C82 and northern part of DFW area • Easterly near-surface winds over Northeast Texas • Background ozone entering Northeast Texas/Northwest LA ~ 50-55 ppb based on LA monitor MDA8 • Local enhancement ≥ 15 ppb 72-hour Back Trajectories Continental Air Mass
Tyler (C82) Hourly Ambient Data: June 30, 2016 7.1 2.4 AQPlot Back Trajectories • Background ozone ~ 55 ppb • Tyler C82 MDA1 was 79 ppb at 5 pm • 3 peaks during the day • Longview C19 MDA1 was 78 ppb at 2 pm • Generally easterly winds at Tyler C82 and Longview C19 • Two SO2 peaks at Tyler C82 (7.1 ppb at 8 am and 2.4 ppb at 2 pm) coincident with enhanced ozone C85 C19 C82
Fires and Smoke: June 28 and June 30, 2016 28 June 2016 6/28 • Satellite-derived fire and smoke data from NOAA Hazard Mapping System (HMS) product • Plotted using online tools at Airnowtech.org • Identical HYSPLIT 72-hour back trajectories in both plots end at Tyler C82 on June 30, 5 pm CST • 3 ending heights: 500 m, 1,000 m, 2,500 m • Tick mark every 6 hours on back trajectories • On June 28, back trajectories passed through large smoke-covered region of central US • Fire emissions may have contributed to background ozone • No large fires immediately upwind of Northeast Texas on June 30 (see next slide) 6/28 6/28 6/28 6/28 6/28 6/28 6/28 500 m 1000 m 2500 m 30 June 2016 500 m 1000 m 2500 m
Regional Smoke and Fires on June 30, 2016 • 24-hour HYSPLIT back trajectories passed close to one fire near TX/LA border • No smoke plume associated with that fire • Fire was not identified in the Forest Service’s BlueSky Smart Fire v2 database -> not a large fire • Fire emissions from Texas, Louisiana, SW Arkansas did not substantially contribute to high ozone in Northeast Texas on June 30
NOxEmissions Sources Upwind of Tyler C82 • TCEQ June 2012, CAMx model-ready NOx emissions • Snapshot of emissions from different year, but can identify source regions • Martin Lake and Pirkey power plants are the largest NOx point sources upwind of Tyler C82 on June 30, 2016 • Several urban areas upwind of Tyler C82, including Tyler, Longview and Shreveport • Oil and gas sources throughout the region Shreveport
Screening Analysis for Upwind SO2 Point Sources • Question: Which upwind SO2 sources could have affected Tyler C82 and produced the observed SO2 peaks at 8 am and 2 pm? • Based on HYSPLIT back trajectories, consider 5 upwind counties: Smith, Gregg, Rusk, Harrison, Panola • TCEQ’s most recent point source emissions file* (2014) reports 4 facilities with SO2 emissions > 1 tpd • Marshall Plant is far from Tyler C82 and has relatively small SO2 emissions; not evaluated • Evaluated SO2 plumes from: Martin Lake, AEP Pirkey and Delek Refinery * TCEQ 2014 annual emissions inventory. Source: https://www.tceq.texas.gov/airquality/point-source-ei/psei.html ** Daily average of June 29-June 30, 2016. Source: https://ampd.epa.gov/ampd/
Screening Analysis Using the HYSPLIT Dispersion Model • NOAA’s HYSPLIT dispersion model estimates plume transport and dispersion • Different from back trajectory HYSPLIT product • The HYSPLIT model is run in forward mode; emissions are released from the top of a facility stack, producing a pollutant plume that moves away from the source and evolves with time • Can assume either puff or particle dispersion. Puffs expand until they reach the meteorological grid cell size and then split into multiple puffs; particles are dispersed by a turbulent wind component • We used HYSPLIT to make a rough estimate of SO2 concentrations at Tyler C82 due to three sources (Martin Lake, Delek, and Pirkey) using emissions for June 30, 2016 • Day-specific for Martin Lake and Pirkey, and TCEQ 2014 average for Delek, as noted on the previous slide • The HYSPLIT dispersion model should be viewed as a screening tool; these calculations very likely overestimate SO2 and model limitations are presented following the End slide
HYSPLIT Screening Analysis Results The Martin Lake SO2 plume at C82 is the same order of magnitude as the observed SO2 concentration at C82 (> 0.01 mg/m3 = 3.8 ppb) The Pirkey SO2 plume at C82 is more than two orders of magnitude smaller than the observed SO2 The Delek SO2 plume at C82 is more than an order of magnitude smaller than the observed SO2. Additional analysis on next slide. • SO2 impacts from Pirkey and Delek are far smaller than those of Martin Lake • Conclude the SO2 impacts at Tyler C82 on June 30, 2016 were likely due to Martin Lake rather than AEP Pirkey or Delek Refining Only Martin Lake has SO2 emissions that produce an SO2 plume concentration the same order of magnitude as the observed SO2 at C82
Summary of June 30, 2016 High Ozone Day at Tyler C82 • Continental air mass with background ozone 50-55 ppb entering NE Texas/NW Louisiana • Fires far upwind in central US may have influenced background ozone levels • No large, nearby upwind fires • Local contribution to MDA8 ozone ~ 15–20 ppb • Easterly winds throughout the day at Tyler C82 -> many potential NOx emissions sources upwind • Enhanced SO2 coincident with morning/early afternoon ozone peaks and dispersion modeling suggests impact from Martin Lake and a far smaller impact from Delek Refinery • Late afternoon peak (5 pm) and winds passing directly over the Tyler urban area suggest a Tyler urban plume impact at 5 pm at the Tyler C82 monitor • Other sources may have contributed, e.g. Shreveport urban plume, oil and gas activity • Summary: high background ozone with superimposed local/regional enhancement from multiple sources
End PREPARED UNDER A GRANT FROM THE TEXAS COMMISSION ON ENVIRONMENTAL QUALITY This presentation was financed through grants from the State of Texas through the Texas Commission on Environmental Quality. The content, findings, opinions and conclusions are the work of the author(s) and do not necessarily represent findings, opinions or conclusions of the TCEQ.
Ozone Trends: Annual 4th High Daily Maximum 8-hour Average (MDA8) Ozone • Lowest 4th high MDA8 ozone values ever recorded at all three monitors • Tyler C82: 63 ppb, Longview C19: 65 ppb, Karnack C85: 59 ppb • In 2016, MDA8 decreased at all monitors compared to 2015 NAAQS 1997: 84 ppb 2008: 75 ppb 2015: 70 ppb
Comparison: NOx Emissions Sources EAST of Tyler C82 Total NOx Emissions Surface Layer O&G NOx Emissions • Oil and gas emissions sources are a large contributor to total NOx emission inventory • Panola, Rusk, Gregg, and Harrison counties in Texas have substantial oil and gas NOx emissions (> 10 tpd for each county) • Caddo and De Soto parishes in Louisiana also emit substantial oil and gas NOx emissions
Comparison of Martin Lake and Delek Refinery SO2 plumes HYSPLIT Screening Analysis SO2 Concentrations (ppb) • HYSPLIT dispersion tool plots have a coarse scale that cannot be altered by the user and are difficult to interpret • Replotted Martin Lake and Delek Refinery plume contours in GIS using same data shown on slide 23 • Selected 3 contours for display in this plot: 3.8 ppb, 0.38 ppb and 0.038 ppb • Martin Lake plume SO2 impact at Tyler C82 is > 3.8 ppb • Delek Refinery SO2 impact at Tyler C82 is between 0.038 ppb and 0.38 ppb • Delek Refinery SO2 impact is more than an order of magnitude smaller than the Martin Lake SO2 impact and not large enough to explain the observed 7.1 ppb SO2 concentration at 8 am when considered alone • HYSPLIT screening results suggest both Martin Lake and Delek Refinery contributed to SO2 monitored at C82, but Martin Lake contribution was far larger
HYSPLIT Modeling Limitations • This HYSPLIT implementation does not incorporate the effects of: • chemical reactions • materials released that are not neutrally buoyant • deposition • complex terrain - other than what is resolved by the meteorological model's terrain • varying emission rate