Download
1 / 47
470 likes | 474 Views
This paper discusses the major challenges and research areas in the US air transportation system, including economic control mechanisms, safety process control, and passenger metrics. It also highlights the need for improved quality of service for passengers and better regulations for airport congestion.

E N D
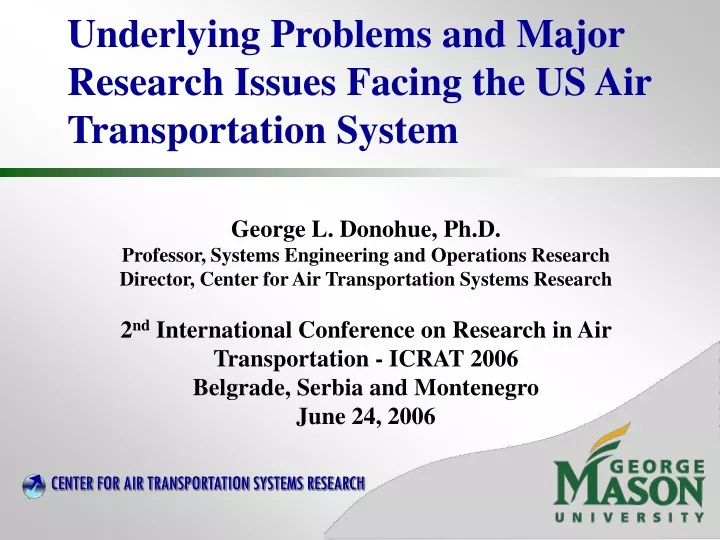
Underlying Problems and Major Research Issues Facing the US Air Transportation System George L. Donohue, Ph.D. Professor, Systems Engineering and Operations Research Director, Center for Air Transportation Systems Research 2nd International Conference on Research in Air Transportation - ICRAT 2006 Belgrade, Serbia and Montenegro June 24, 2006
Credits • Research Team at GMU that have contributed to these Insights: • Rudolph C. Haynie, Ph.D. (2002), Col. US Army • Yue Xie, Ph.D. (2005) • Arash Yousefi, Ph.D. (2005) • Loan Le, Ph.D. Candidate (expected 2006) • Danyi Wang, Ph.D. Candidate • Babak Jeddi, Ph.D. Candidate • Bengi Mezhepoglu, Ph.D. Candidate • Dr. Lance Sherry, Exec. Dir. CATSR • Dr. John Shortle, Assoc. Prof. SEOR, CATSR • Dr. C.H. Chen, Assoc. Prof. SEOR, CATSR • Dr. Karla Hoffman, Prof. SEOR, CATSR
Outline • Worldwide Generic Problems in Air Transportation • Economic System of Systems • Stochastic Safety Process Control • Airspace Designs are not Optimum • US has some Unique Problems in Air Transportation • Little Concern for Passengers Quality of Service • Airport Congestion Regulations Chaotic • Future Research should focus more on: • Passenger Metrics and less on Aircraft Operations Metrics • Stochastic Metrics and Regulations • Economic System Control Mechanisms
Air Transportation is a Complex Adaptive System (CAS) Problem • Essential Elements of a CAS: • Complex • Multiple Agents with many variables always working on the Edge of Stability • Possess Strong Non-linear Interrelationships but Try to bring some Order out of Chaos • Spontaneous and Self Organizing • Multiple Independent Agents Optimizing different Object Functions (i.e. constantly Learning and Adapting) • Evolutionary • constantly demonstrating Emergent Behavior • Requires a Different Modeling Approach that Includes ALL Relevant Strong Feedback Loops
Air Transportation System:Agents, Inter-relationships, Adaptive Behavior and Stability Capacity Offset Suppliers of Air Traffic Flow Services Air Navigation Service Providers ( = 7 years, Variations: Daily due to Weather) AARs, ADRs Aircraft per Sector, Runway /Unit Time Aircraft per Sector, Runway /Unit Time Suppliers of Air Traffic Infrastructure Suppliers of Air Traffic Infrastructure Airports (Air-side) ( = 2, 10, 30 years) Airspace ( = 1-2 years) Taxiways Runways, Ap/Dp Cor., Airways Scheduled Flights Suppliers of Air Transportation Services Suppliers of Air Transportation Services Airports (Land-side) ( = 2, 10, 30 years) Airlines ( = 3 Months) Total Seats Seats, Parking, Rental Cars Enplanements Demand for Air Transportation Services Demand for Air Transportation Services Regional Markets (Businesses, Citizens) ( = weeks, Variations: Daily, Weekly, Seasonal, Econ Cycles)
CAS Control Problem: Example Question What is Impact of ADS-B ? Plausible Futures? • Modernization requires understanding system “pressure points” and “tipping points” (i.e. nonlinearities) • Signaling Mechanisms DRIVE Air Transportation System • Balance Capacity and Demand (by signaling scarce resources) • Incentivize Innovation • Strong Signals (i.e. PRICES) yield: • Effective Use of Scarce Resources (e.g. yield management, aircraft assets,…etc) • Vibrant Innovation in Airlines, and Aircraft Manufacturers sectors (see Real Yield) • Weak Signals (e.g. Delays, Flat Fees & Taxes) yield: • Unpredictable day-to-day Operations • Difficulty Valuing Service (e.g. Airport Landing Slots, Labor Salary Negotiations) • Dormant Innovation Cycles Air Navigation Service Providers ( = 7 years, Variations: Daily due to Weather) Aircraft per Sector, Runway /Unit Time ADS-B Initiatives Aircraft per Sector, Runway /Unit Time Airports (Air-side) ( = 2, 10, 30 years) Airspace ( = 1-2 years) Taxiways Rwys App. Spac, Airways Delays, Flat Fees & Taxes Scheduled Flights Airports (Land-side) ( = 2, 10, 30 years) Airlines ( = 3 Months) Seats, Parking, Rental Cars Airfares, + fees, taxes, delay costs Enplanements Regional Markets (Businesses, Citizens) ( = weeks, Variations: Daily, Weekly, Seasonal, Econ Cycles) Dr. Lance Sherry and Benji Mezhepoglu
Stochastic Safety Process Control • - Solid Theoretical Foundation NOT BEING APPLIED TO ATM
Air Transportation Safety is a Stochastic Characterization and Control Problem • International Safety Standards do not recognize that they are Regulating Stochastic Processes that have at least 2 Statistical Parameters that MUST BE CONTROLLED • Research results of : • Dr. Rudolph C. Haynie (2002) • Dr. Yue Xie, (2005) • Mr. Babek Jeddi, (in progress) • Prof. John Shortle
Operations Around a Typical High Capacity US Airport (Mr. Babak Jeddi, research in progress) Detroit Airport (DTW)
Sample Landings on 21L:GMU Processed Multilateration Data Distorted Scale Correct Scale
Data Analysis Process to Estimate:IAT, IAD and ROT pdf’s Airplane i Threshold Airplane i+1 Runway . . . . . . . . . Col. Clint Haynie, USA PhD., 2002 Yue Xie, PhD. 2005
Runway Occupancy Time (ROT) at AAR = 40 Arr/Rw/Hr 49 seconds 40 Ar/Rw/Hr =90 seconds • 669 samples for all aircraft types, peak IMC periods • Sample mean is 49.1 sec. • Sample std. dev. is 8.1 sec.
Inter-Arrival Time (IAT) SAFETY ? 40 Ar/Rw/Hr LOST CAPACITY • IMC • 3 nm pairs • 523 samples (during peak periods) • Fit: Erlang(40;11,6): mean 106 sec, std. dev. 27 sec.
Inter-Arrival Distance (IAD) SAFETY ? ADS-B RSA LOST CAPACITY Schedules, TFM, RTA • IMC • 3 nm pairs • 523 samples (during peak periods) • Fit: Erlang(1.5;0.35,6): mean 3.6 nm, std. dev. 0.86 nm.
ROT vs. IAT to find Simultaneous Runway Occupancy (SRO) Probability: est to be ~1 x 10⁻³ SRO Region Runway Occupancy Time (sec) Inter-Arrival Time (sec) • Freq (IAT < ROT) ~= 0.0016 in peak periods and • 0.0007 overall (including non-peak periods) • IMC: 1 / 669= 0.0015 in peak periods • Correlation coefficient = 0.15
ROT vs. IAT to find Simultaneous Runway Occupancy (SRO) Probability: est to be ~1 x 10⁻³ SRO Region Runway Occupancy Time (sec) Inter-Arrival Time (sec) • Question: • Should P(SRO)= 1 x 10⁻⁶ /Arrival? • 1 x 10⁻⁵ /Arrival? • 1 x 10⁻⁴ /Arrival?
Runway Occupancy Time (ROT) and Increased AAR to 45 Arr/Rw/HR 45 Ar/Rw/Hr • 669 samples for all aircraft types, peak IMC periods • Sample mean is 49.1 sec. • Sample std. dev. is 8.1 sec.
Inter-Arrival Time (IAT) SAFETY ? 45 Ar/Rw/Hr LOST CAPACITY • IMC • 3 nm pairs • 523 samples (during peak periods) • Fit: Erlang(40;11,6): mean 106 sec, std. dev. 27 sec.
ATC Workload is not Uniform and Airspace Designs are Not Optimum • Current Airspace Designs in most countries pre-date modern computer Modeling and Optimization era • Controller Workload can become the Capacity Limitation in some Airspace • Current Controller Workload can be Decreased with Center and Sector Optimized Re-design • All New digital Data-Link and Automation Systems will Benefit from Re-designed, workload balanced airspace Based on Research results of Arash Yousefi (2005)
WL as a continuous function of Lat, Lon, and Time (Arash Yousefi, Ph.D. 2005)
Passengers are Our Forgotten Customers • - They Pay the Bills & Suffer the Penalties for Poor performance
Passenger Quality of Service Metrics are NOT Currently used for System Control • Most Research Emphasis has been on Flight Delay and Airline Economic Benefits from Reduced Fuel Consumption • Little attention has been placed on the Passenger Quality of Service (PQOS) or on the real Lost Human Productivity • Lost Passenger Productivity (GDP) due to System Inefficiencies may EXCEED Airline fuel burn Losses • Flight Cancellations are as Important to Understand and Model as Flight Delays
Recent Observations on Flights in the US 35 OEP Airport Network (2004) • Total Passenger Trip Delay (TPTD) metric defined (Danyi Wang (2006) work in progress) • OEP 35 Airport Network: • 3,000,000 flights, 1044 segments • 20.5% delayed > 15 min (52,100,000 Hours Delayed) • 1.78% flights cancelled (34,300,000 Hours Delayed) • At $30/Hr = $2.6 Billion/yr Lost GDP Productivity
The Air Transportation System can be Modeled as a Two Tiered Flow Model • A two tiered flow model: the Vehicle Tier and the Passenger Tier(Ms. Danyi Wang, research in Progress) • Vehicle Tier Key Performance Index (KPI): Flight Delays, # of Delayed Flights, Cancelled Flights, On-Time Flights, % of Delayed Flights, Cancelled Flights, On-Time Flights, etc. • Passenger Tier KPI: Passenger Trip Delay • Passenger Trip Delay = function (“Vehicle Flight Performance”, “Passenger Factor”)
Strong Non-Linear Relationship Exists between Flight Disruptions, Load Factors, Time and Total Passenger Delay • Results: • Average Passenger Delay grows Exponentially with load factor, especially for days with high flight delays and cancellations. • Low Service Frequency and Flight Disruptionslate in the day contribute significantly to the delay of disrupted passengers Bratu & Barnhart (2005), Bratu (2003) and Sarmadi (2004)
Airports Need Some Schedule Regulation for Safe, Efficient and Predictable Transportation
US Does Little to RegulateAirport Congestion • Flight Schedules Drive Much of the Flight Delays Observed in the US Air Transportation System • Schedules are Uncoordinated (Anti-Trust Laws) • Largely Unregulated by Arrival Slot Allocations • These Delays at Hub Airports Impact the entire Air Transportation Network • Regulators are Concerned about the Adverse Effects of Slot Regulation (for Congestion Management) on the Private Service Provider’s Decisions on what Markets to Serve • i.e. What network connectivity and frequency would result from profit maximizing airlines if Capacitated Airport nodes were Regulated? • This Question can be formulated as a Network Commodity Flow Optimization Problem (Ms. Loan Le, summer 2006)
Deregulation AIR-21 Slot ownership 1978 4.2000 1985 • Exempted from HDR at LGA certain flights to address competition and small market access • Use-it-or-lose-it rule based on 80% usage Excess of demand and severe congestion at NY area airports: a 40-year old reality Timeline recap of congestion management measures HDR at EWR, LGA, JFK, DCA, ORD Perimeter rule at LGA, DCA 1969 early 1970s Removal of HDR at EWR - Limited #IFR slots during specific time periods - Negotiation-based allocation
Excess of demand and severe congestion at NY area airports: a 40-year old reality Timeline recap of congestion management measures • End of HDR. • What’s next? Lottery at LGA Removal of HDR at ORD AIR-21 Jul-02 Jan-07 Apr-00 Jan-01
Excess of demand and severe congestion at NY area airports: a 40-year old reality Timeline recap of congestion management measures • End of HDR. • What’s next? Lottery at LGA Removal of HDR at ORD AIR-21 Jul-02 Jan-07 Apr-00 Jan-01
Declining Trend of aircraft size: Fewer Passengers at Constant Congestion Delay
Small Aircraft & Low load-factor Flights: High Delay & Lost Airline Revenue ?
Congestion management options • Laissez-faire: AIR-21 • HDR • Airport expansion Building new runway, new airport? Develop reliever airports? • Administrative options: Collaborative scheduling Bilateral? Multilateral? • Market-based • Congestion pricing • Auction • Question: What is the best use of runway capacities? • What markets get to stay at their current airport? • What should fly to other substitutable airports? • What is the right fleet mix and frequencies?
Modeling airline flight scheduling: Approaches • Model individual airlines • Infinite number of competition behaviors • New entrants? • Limited data and inherent data noise • Model a Benevolent Single Airline • Incorporates some competition requirement • Best schedule that could be achieved benchmark for congestion management incentives • Aggregate data reduce noise Problem statement Assuming the government as a benevolent single airline in NYC, how would that airline optimize the flight schedule to LGA/EWR/JFK?
New York LGA case study • A few statistics: • Operations Throughput: 93,129 flights • Average Flight Delay: 38 min • Seat throughput: 8,940,384 seats • Average aircraft size 96 seats • Number of regular markets* 66 (277) • Average segment fare: $133 • Revenue Passengers: 6,949,261 • Modeling Assumptions • target period: Q2, 2005 • 45 minutes turn-around time for all fleets • 75% load factor • Fuel cost: $2/gallons • Only existing fleets
Market daily frequencies and geographical distribution: actual data
(unconstrained scenario) Results: Profit maximizing service levelsfor unconstrained capacity scenario Markets decreasing: BOS 7446 DCA 6842 FLL 4224 RDU 3622 ORD 6248 ATL 4834 PHL 2010 DFW 2618 CLT 3224 …
Results: Maximizing service levels at 10 ops/runway/15min Throughput maximizing: BOS 74 58 DCA 68 60 FLL 4444 RDU 3636 ORD 62 50 ATL 48 32 PHL 20 12 DFW 26 22 CLT 32 20 … Profit maximizing: BOS 7446 DCA 6842 FLL 4424 RDU 3622 ORD 6248 ATL 4834 PHL 2010 DFW 2618 CLT 3224 …
Throughput Maximizing service level at 9 ops/runway/15min Throughput maximizing: BOS 7458 DCA 6860 FLL 4444 RDU 363620 ORD 625044 ATL 483230 PHL 2012 DFW 26 2218 CLT 3220 CHM 26 20 GSO 18 12 IND 18 12 BUF 22 16
Throughput Maximizing service level at 8 ops/runway/15min Throughput maximizing: BOS 7458 DCA 6860 FLL 4444 30 RDU 363620 ORD 625044 34 ATL 483230 PHL 2012 10 DFW 262218 CLT 3220 CHM 2620 GSO 18 12 IND 18 12 BUF 22 16 DTW 32 20
Summary of results for LGA Non-monotonic behavior for profit maximizing schedules Monotonic behavior for seat throughput maximizing schedules
Directions for Future Research • Future Research should focus more on: • Passenger Metrics and less on Aircraft Operations Metrics • Stochastic Metrics and Regulations • Optimum Airport Slot Utilization • Economic System Control Mechanisms • Dynamic Super-Sector Designs with Optimum Convective Weather Avoidance Capability
References • Haynie, R.C. (2002), “An Investigation of Capacity and Safety in Near-Terminal Airspace for Guiding Information Technology Adoption” GMU PhD dissertation • Yousefi, A. (2005), “Optimum Airspace Design with Air Traffic Controller Workload-Based Partitioning” GMU PhD disertation • Xie, Y. (2005), “Quantitative Analysis of Airport Arrival Capacity and Arrival Safety Using Stochastic Methods” GMU PhD dissertation • Le, L. (2006 expected), “Demand Management at Congested Airports: How Far are we from Utopia?” GMU PhD dissertation • Wang, D., Sherry, L. and Donohue, G. (2006) “Passenger Trip Time Metric for Air Transportation”, The 2nd International Conference on Research in Air Transportation (ICRAT), June 2006 • Jeddi, B., Shortle J. and L. Sherry, “Statistics of the Approach Process at Detroit Metropolitan Wayne County Airport”, The 2nd International Conference on Research in Air Transportation (ICRAT), June 2006 • http://catsr.ite.gmu.edu/home.html